
What is DRAMON? Is it a new cryptocurrency called "DRAM," or a tokenized ETF tied to the global memory chip industry? Does buying DRAMON mean you directly hold Roundhill Memory ETF through a securities account?
According to publicly disclosed asset information from Ondo Global Markets, DRAMON’s underlying asset is the Roundhill Memory ETF, whose traditional-market ticker is DRAM. The current product relationship is:
1 DRAMON = 1.00 DRAM.
This means DRAMON’s core value does not come from an independent blockchain protocol, token burns, or community narratives. Instead, it comes from the Roundhill Memory ETF and the global storage industry behind it—including companies such as Samsung Electronics, SK hynix, Micron, Seagate, and Western Digital.
These companies sit at the heart of the DRAM, NAND Flash, HBM, SSD, HDD, and data‑center storage supply chain. With the rapid growth of AI servers, the market is revisiting a question that has often been underestimated:
As GPU computing power grows ever stronger, can data be delivered to the GPU fast enough?
High‑Bandwidth Memory (HBM) is one of the key hardware solutions to this bottleneck. Thus, DRAMON carries three layers of identity: a Memory ETF, an AI infrastructure play, and a tokenized RWA asset.
But investors should not get carried away by popular tags like "AI," "HBM," and "Tokenized ETF." Memory chips remain a highly cyclical manufacturing business. DRAM prices, inventories, capital expenditures, and new capacity additions all materially affect corporate profits.
DRAMON also introduces risks that traditional ETFs do not have—or manifest differently—including token issuance structure, underlying asset custody, secondary‑market liquidity, premiums/discounts, and regional compliance restrictions.
Risk Disclosure: This article is for asset‑mechanism introduction, industry research, and educational purposes only. It does not constitute investment advice, a promise of returns, or a trading recommendation. DRAMON may be simultaneously affected by the Roundhill Memory ETF, its underlying constituents, the Memory Cycle, AI capital expenditure, the token issuance structure, and crypto‑market liquidity. Before trading, please verify the latest product documents, regional restrictions, and risk disclosures from Ondo and the trading platform.
1. What Is DRAMON, and Why Would a Memory Chip ETF Appear in Crypto Markets?
DRAMON is a tokenized ETF within the Ondo Global Markets framework, with the Roundhill Memory ETF as its underlying asset.
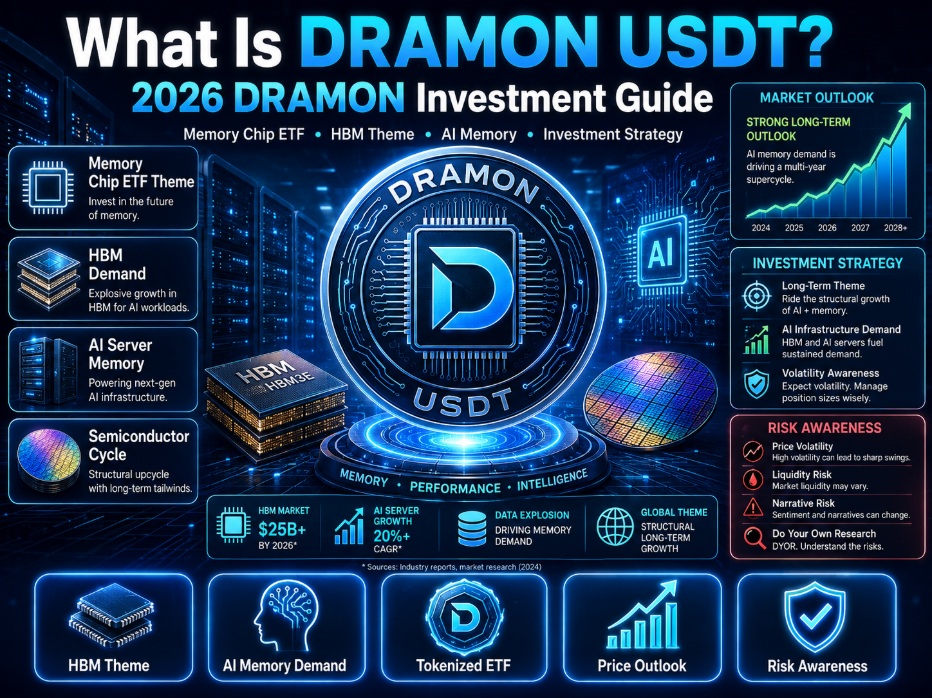
In traditional markets, the Roundhill Memory ETF trades under the ticker DRAM. DRAMON is the identifier for this ETF within Ondo’s tokenized‑asset system.
Investors can view current trading prices, percentage changes, and market activity via the DRAMON real‑time price and DRAMON/USDT market data.
However, a DRAMON price page can only tell you the current trading price of the token; it does not, by itself, tell you whether the underlying ETF is reasonably valued, nor does it prove that the token is free of premium or discount.
What Underlying Asset Backs DRAMON?
DRAMON corresponds to the Roundhill Memory ETF.
This ETF builds its portfolio around the global memory industry. Its goal is not to broadly hold all semiconductor companies, but to provide concentrated exposure to markets tied to memory chips and data‑storage devices.
According to Ondo’s disclosed underlying holdings as of August 6, 2026, the major constituents include:
- Samsung Electronics;
- SK hynix;
- Micron;
- Seagate;
- Western Digital.
The portfolio may also include U.S. Treasuries, money‑market funds, cash‑like instruments, and certain equity swap positions to manage liquidity and construct investment exposure.
Therefore, it is inaccurate to simply describe DRAMON as "a token of Samsung, SK hynix, and Micron."
A more precise statement is:
DRAMON, by tokenizing the Roundhill Memory ETF, offers investors economic exposure to a global Memory‑themed portfolio composed of equities, derivatives, and cash‑like assets.
Specific constituents, weights, and cash proportions may change with the ETF’s rebalancing. Investors should rely on the latest disclosures from Roundhill and Ondo.
Is DRAMON an Ordinary Crypto Token?
DRAMON exists in blockchain‑token form and can be held and transferred on eligible platforms or chains. However, it is not a crypto‑native asset like BTC, ETH, a meme coin, or a DeFi governance token.
BTC’s value comes from the Bitcoin network, its fixed supply, and market demand.
ETH’s value is tied to Ethereum network usage, gas fees, staking, and on‑chain ecosystem activity.
Meme coins are driven more by community, attention, narratives, and liquidity.
DRAMON’s core value derives from the market performance of the Roundhill Memory ETF.
Therefore, analyzing DRAMON should not focus on:
- Total token supply;
- Fully diluted valuation (FDV);
- Team unlocks;
- Community hype;
- Token burns;
- On‑chain governance.
Instead, you should focus on:
- ETF net asset value (NAV);
- Underlying holdings;
- Memory‑company profitability;
- DRAM, NAND, and HBM prices;
- Industry inventories;
- AI server demand;
- The token’s premium or discount relative to the underlying ETF.
Does Buying DRAMON Equal Directly Holding the DRAM ETF?
You cannot simply say "it is exactly the same."
Traditional ETF investing typically involves:
An investor buying ETF shares through a brokerage account and holding the asset under the relevant securities‑market rules.
The DRAMON holding path is:
An investor holds the token through a crypto platform or blockchain environment, and the issuance, custody, and legal structure provide economic exposure linked to the underlying ETF.
Both may track the same underlying value, but they can differ in:
- Account and asset registration methods;
- Investor legal status;
- Dividend handling mechanisms;
- Voting rights or fund‑holder rights;
- Minting and redemption eligibility;
- Trading hours;
- Custody arrangements;
- Bankruptcy treatment;
- Regional restrictions;
- Investor‑protection rules.
Thus, a more accurate understanding is:
Holding DRAMON mainly gives you economic exposure close to that of the Roundhill Memory ETF, but it should not be construed as holding an identical ETF share in a traditional brokerage account.
Specific legal rights must be governed by Ondo’s product documents and the applicable rules of your jurisdiction.
2. Why Does the Roundhill Memory ETF Deserve a Dedicated Storage‑Theme Fund?
A broad semiconductor ETF may simultaneously hold GPU, CPU, foundry, equipment, analog, networking, and memory companies.
The Roundhill Memory ETF concentrates its theme on the memory and data‑storage industry.
This concentration provides a more direct reflection of the memory cycle and AI‑memory demand—but it also means lower industry diversification compared to broad tech ETFs and large‑cap equity ETFs.
What Exactly Does the Memory Industry Include?
Many newcomers think of PC RAM modules when they hear "memory."
In reality, the modern memory industry is much broader, including:
- DRAM;
- HBM;
- NAND Flash;
- Enterprise‑grade SSDs;
- Consumer SSDs;
- HDDs;
- Data‑center storage;
- Mobile and PC memory;
- AI server memory;
- Cloud computing storage;
- Automotive and industrial storage.
Every digital system needs to process and store data. GPUs, CPUs, and AI accelerators handle computation; memory and storage allow data to be read quickly, processed temporarily, and preserved for the long term.
The stronger the compute power, the larger the models, and the greater the data volume—the more important memory typically becomes.
Why Not Just Buy a Broad Semiconductor ETF?
The advantage of a broad semiconductor ETF is industry diversification, covering design, manufacturing, equipment, and a wide range of chip products.
The advantage of a Memory ETF is a more focused theme.
If your core thesis is:
- DRAM prices entering an upcycle;
- HBM in short supply;
- AI server memory capacity continuing to grow;
- Data centers needing more storage;
- Memory‑manufacturer profits improving markedly;
then a Memory ETF may reflect that view more directly than a broad semiconductor ETF.
But concentration also means higher risk.
If storage prices enter a downcycle, a Memory ETF may lack the cushion provided by other semiconductor sub‑sectors.
What Basket of Assets Does DRAMON Actually Buy?
From an industry perspective, the underlying ETF primarily provides the following exposures:
First, memory semiconductors—including DRAM, NAND, and HBM businesses of Samsung Electronics, SK hynix, and Micron.
Second, data‑storage devices—including HDDs, enterprise storage, and data‑center products from Seagate, Western Digital, and others.
Third, cash‑management and portfolio‑implementation tools—including Treasuries, money‑market funds, and swap positions.
So DRAMON is not a pure HBM ETF, nor does it bet on just one memory company.
It is closer to a basket of global memory and storage industry assets.
3. Why Has the AI Era Put DRAM, HBM, and Memory Chips Back in the Investment Spotlight?
The most visible part of the AI industry is GPUs.
But an AI server is not just a GPU. It also needs CPUs, networking, memory, storage, power, cooling, and data‑center infrastructure.
If memory bandwidth is insufficient, the GPU cannot continuously receive the data it needs to process. The more powerful the compute chip, the more acute this problem becomes.
Why Is Memory Indispensable for AI Computing?
The full transmission chain can be understood as:
AI model parameters increase → training and inference require processing more data → as GPU compute improves, model parameters and training data must be read faster → traditional memory bandwidth may become the system bottleneck → AI servers therefore equip more high‑performance HBM and DRAM → memory manufacturers see orders, revenue, and potentially profits grow.
A GPU can perform massive parallel computations, but it cannot conjure data out of thin air.
If you think of the GPU as a high‑speed factory, memory is the transport system that continuously feeds raw materials to the production line. If the factory expands but the transport system is not upgraded, the new capacity remains underutilized.
What Is HBM?
HBM stands for High‑Bandwidth Memory.
Compared with standard DDR memory, HBM uses advanced chip stacking, interconnects, and packaging technologies to achieve much higher data‑transfer bandwidth in a compact space.
Key advantages of HBM include:
- Higher bandwidth;
- Shorter data paths;
- Greater capacity per unit area;
- Better suited for GPU parallel computing;
- Potentially higher energy efficiency per data transfer;
- Reduced GPU idle time waiting for data.
AI training requires frequent reads of massive model parameters and intermediate data. The larger the model, the higher the demand for VRAM capacity and memory bandwidth.
This is a major reason why NVIDIA and other AI accelerators rely heavily on HBM.
How Does HBM Differ from Standard DDR?
Standard DDR is widely used in PCs, servers, and consumer electronics—it is mature, general‑purpose, and relatively cost‑effective.
HBM is designed primarily for high‑performance computing, AI GPUs, and premium accelerators.
Both are memory, but they differ significantly in packaging, bandwidth, cost, application scenarios, and manufacturing complexity.
Standard DDR still commands a huge market, while HBM more directly reflects AI infrastructure demand.
Why Can HBM Margins Be Higher Than Traditional DRAM?
HBM typically involves higher technical and manufacturing hurdles, including:
- Chip stacking;
- TSV (through‑silicon via) interconnects;
- Advanced packaging;
- More complex testing;
- Higher yield requirements;
- Stricter customer qualification;
- GPU‑platform co‑optimization;
- Limited high‑end capacity.
When AI customers have strong demand for HBM and qualified supply is relatively constrained, manufacturers can command higher average selling prices and margins.
However, high margins attract investment. If Samsung, SK hynix, and Micron all rapidly expand capacity, future supply growth may gradually erode that pricing advantage.
Why Is DRAMON Like the "Picks and Shovels" of AI?
DRAMON does not bet on whether any single AI chatbot succeeds; it bets that the AI industry as a whole will need more compute and storage infrastructure.
The chain is:
AI companies develop and operate models → cloud providers build data centers → data centers purchase GPU servers → GPU servers need HBM and DRAM → massive AI data also requires SSDs and HDDs for long‑term storage → memory and storage companies receive orders → the Roundhill Memory ETF reflects these companies’ market performance → DRAMON offers a tokenized economic exposure to that ETF.
This is an AI‑infrastructure investment logic.
But "picks and shovels" does not mean risk‑free. If the entire industry expands too fast, prices fall, or AI capital expenditure disappoints, infrastructure companies can also face profit pressure.
4. Who Are the Key Companies Behind DRAMON?
To understand DRAMON, you need to look beyond the ETF name and know the roles each underlying company plays.
Samsung Electronics
Samsung Electronics is a major global manufacturer of DRAM, NAND, and semiconductors.
When analyzing Samsung’s value in a DRAM ETF, watch:
- DRAM market share;
- NAND business;
- HBM product progress;
- Major AI customer qualifications;
- Advanced process and packaging;
- Semiconductor capex;
- Memory‑business profits;
- Inventory changes.
Samsung’s business is highly diversified—beyond memory, it also covers mobile, consumer electronics, displays, foundry, and more.
Thus, Samsung’s stock price is not driven solely by the Memory Cycle.
That can provide some business diversification, but it may also reduce its sensitivity to a pure‑memory upside thesis.
SK hynix
SK hynix is a major global DRAM and NAND supplier and a key player in the AI HBM supply chain.
Key factors to watch for SK hynix include:
- HBM product iterations;
- Supply relationships with NVIDIA and other customers;
- HBM revenue mix;
- High‑end DRAM market share;
- Average selling prices;
- Operating profit;
- Capital expenditure;
- Capacity utilization.
SK hynix may offer higher earnings leverage to HBM and the Memory Cycle, but its concentrated business also makes it more vulnerable to a memory‑cycle reversal.
Micron
Micron is a major U.S. memory player, covering DRAM, NAND, and HBM.
Investors should pay attention to:
- Data‑center revenue;
- HBM orders;
- DRAM average selling prices;
- NAND pricing;
- Gross margins;
- Inventory days;
- Capital expenditure;
- Management’s outlook on supply/demand for the next phase.
Micron’s earnings calls and guidance are often used by the market as key windows into the global Memory Cycle.
Seagate and Western Digital
The memory theme is not limited to semiconductor memory.
Seagate and Western Digital are major players in HDDs, enterprise storage, and data‑center storage.
AI does not only require real‑time computation—it also generates and preserves enormous amounts of data. Training datasets, model files, enterprise data, logs, and backups all need long‑term storage.
Thus, AI data growth can also drive:
- Enterprise HDDs;
- High‑capacity storage;
- Data‑center storage systems;
- SSDs;
- Cloud‑storage infrastructure.
Seagate and Western Digital add storage exposure to the DRAM ETF, making it more than just a combination of HBM and DRAM.
5. The Biggest Investment Thesis for DRAMON Is the Memory Cycle
AI has raised long‑term demand expectations for the memory industry, but the core driver of profit swings remains the supply‑demand cycle.
What Is the Memory Cycle?
A typical Memory Cycle follows this pattern:
End‑demand increases or manufacturers cut production → industry inventories decline → as inventories fall, DRAM and NAND prices begin to rise → higher average selling prices boost revenue and profits → rising profits prompt manufacturers to increase capex and expand capacity → new capacity gradually comes online, supply growth outpaces demand → customer and manufacturer inventories rise again → DRAM and NAND prices fall → profits contract, and manufacturers cut capex → supply growth slows, and the industry enters a new recovery.
Demand drivers include:
- AI servers;
- General‑purpose servers;
- Smartphones;
- PCs;
- Gaming devices;
- Automotive;
- Industrial equipment;
- Data‑center storage.
Supply factors include:
- Wafer capacity;
- Process node transitions;
- HBM capacity allocation;
- Yields;
- Capital expenditure;
- Production cuts;
- New fab ramps;
- Customer inventory levels.
Why Are Memory Earnings So Leveraged?
Memory manufacturing requires fabs, equipment, R&D, and heavy fixed assets—fixed costs are high.
When DRAM prices rise, manufacturers do not necessarily increase costs proportionally. A large portion of incremental revenue can flow to the bottom line, so operating profit growth can significantly outpace revenue growth.
Conversely, when DRAM prices fall, depreciation, labor, and equipment costs do not disappear immediately, so margins can compress rapidly.
Thus, memory companies commonly exhibit:
- Cyclical revenue swings;
- Wide gross‑margin fluctuations;
- Earnings changes larger than price changes;
- Stock prices that lead the next phase of the cycle;
- Profits that look best at cycle peaks;
- Financials that look worst at cycle troughs.
This is why you cannot judge whether a memory stock is cheap just by looking at current profits.
The market trades the future, not already‑reported quarterly numbers.
Why Might DRAMON Be More Volatile Than a Broad‑Market ETF?
The Roundhill Memory ETF is concentrated in memory, semiconductor, and data‑storage companies—it lacks the industry diversification of the S&P 500.
When storage prices rise and HBM demand is strong, concentration can deliver higher upside.
But when the industry is oversupplied, AI capex slows, or DRAM prices fall, multiple constituents may come under pressure simultaneously.
DRAMON also faces bid‑ask spreads and premium/discount dynamics in token markets, so actual volatility may exceed changes in the underlying ETF’s NAV.
6. Can AI Permanently Change the Traditional DRAM Cycle?
The answer: AI may raise the long‑term demand baseline for memory, but it will not make the supply‑demand cycle disappear.
Optimistic Scenario: AI Creates Structural Demand
AI could drive lasting changes such as:
- Rapid HBM demand growth;
- More HBM per GPU;
- Increasing AI server counts;
- More memory needed for inference services;
- Expanding data‑center scale;
- Higher DRAM capacity per general‑purpose server;
- AI data requiring more long‑term storage;
- A rising share of high‑end memory;
- Improved profit structures for memory companies.
If these trends persist, the industry’s demand baseline could be higher than in the past, when it relied mainly on PCs and smartphones.
Cautious Scenario: Manufacturing Still Binds Supply and Demand
Memory remains a manufacturing business that requires massive capital spending.
When the market sees high HBM margins, companies increase investment, improve yields, and expand capacity. As supply grows, customers gain more bargaining power.
If AI server growth falls short of expectations, or if manufacturers ramp up faster than demand, the industry can still see:
- Inventory builds;
- ASP declines;
- Lower capacity utilization;
- Gross‑margin compression;
- Capex cuts;
- Share price pullbacks.
A balanced conclusion is:
AI may raise the long‑term demand baseline and improve the product mix of the Memory Cycle, but it cannot eliminate inventory, capacity, and pricing cycles entirely.
7. Why Does DRAMON Rise? Seven Factors to Watch
A DRAMON rally should not be attributed solely to crypto‑market hype.
Roundhill Memory ETF Appreciation
This is the most direct driver.
If the underlying ETF’s NAV rises, under normal tracking and arbitrage mechanisms, DRAMON’s reference value should rise correspondingly.
DRAM Price Increases
Rising DRAM spot and contract prices can boost future earnings expectations for Samsung, SK hynix, and Micron.
However, distinguish between short‑term spot fluctuations and long‑term contract trends.
Rising HBM Demand
AI GPU shipments, higher HBM capacity per GPU, and new accelerator launches can all increase HBM demand.
The market also watches which customer qualifications suppliers secure and whether orders convert into actual revenue.
Core Constituent Rallies
If Samsung, SK hynix, Micron, Seagate, and Western Digital all rise broadly, the Roundhill Memory ETF and DRAMON may benefit in tandem.
The impact of a single company’s rise on the ETF also depends on its actual weight in the portfolio.
NVIDIA and AI Server Sentiment
NVIDIA’s performance and the broader AI‑server supply chain can influence expectations for HBM and data‑center storage demand.
But NVIDIA rising does not automatically mean all memory companies will see earnings improve equally—supply shares, pricing, and competition also matter.
Interest Rates and Global Risk Appetite
Memory is a capital‑intensive, cyclical tech sector.
When rates fall or global risk appetite improves, the market may assign higher valuations to growth and tech assets. When rates rise or recession fears intensify, valuations may come under pressure.
DRAMON’s Own Liquidity
DRAMON trades in crypto secondary markets and can also be affected by:
- CEX trading volume;
- On‑chain liquidity;
- USDT inflows;
- Market‑making depth;
- Platform activity;
- Deposit/withdrawal status;
- Premiums;
- Discounts.
Thus:
DRAMON’s medium‑ to long‑term value primarily comes from the Roundhill Memory ETF, but its short‑term traded price may also be influenced by crypto‑market liquidity and pricing deviations.
8. Why Might DRAMON’s Price Temporarily Differ from the DRAM ETF?
Ondo’s public page shows the current relationship as 1 DRAMON = 1 DRAM.
That provides a clear basis for comparing token price and underlying ETF value, but it does not mean the two markets will be perfectly aligned at all times.
How Does DRAMON Track the DRAM ETF?
Under normal conditions, the underlying ETF price, token issuance/redemption mechanisms, and market‑maker arbitrage help DRAMON track the DRAM ETF’s reference value.
If DRAMON trades significantly above the underlying ETF’s value, eligible participants may increase supply via minting or arbitrage.
If DRAMON trades significantly below the underlying value, participants may buy the token and arbitrage through the corresponding redemption channel.
However, whether retail users can directly mint or redeem, and the minimum amounts, KYC, and regional eligibility requirements, depend on Ondo’s latest rules.
What Does 24/5 Mint/Redeem Mean?
Public information indicates that eligible Ondo Global Markets users can mint and redeem assets within a 24‑hour‑per‑day, 5‑day‑per‑week window.
That is longer than the regular trading session of U.S. equities, helping global markets adjust prices to new information.
But 24/5 is not equivalent to 24/7 around‑the‑clock minting/redemption.
On weekends, holidays, when underlying markets are closed, or during platform maintenance, the arbitrage efficiency between token price and underlying assets may decline.
The token may continue to transfer on the blockchain, but that does not mean there will always be sufficient buyers, sellers, or redemption channels at any given time.
What Are Premium and Discount?
Suppose the Roundhill Memory ETF reference price is $55:
If DRAMON trades at $57, the token has a premium of about 3.64% relative to the underlying reference value.
If DRAMON trades at $53, the discount is about 3.64%.
For a practical assessment, you also need to consider:
- The ETF’s latest NAV;
- Real‑time market price;
- Bid‑ask spread;
- Product fees;
- Accrued income;
- Dividend treatment;
- Mint/redemption fees;
- Data update timing;
- Whether the underlying market is open.
Investors should not conclude that memory‑company earnings have improved just because DRAMON is rising. The rise could also come from an expanding token premium.
9. What Should You Watch for DRAMON Price Predictions?
Investors can refer to DRAMON price prediction to observe trends and different market scenarios.
But DRAMON is a tokenized ETF, so price predictions cannot rely solely on crypto candlesticks or a single technical indicator.
Memory Prices
Key items to monitor:
- DRAM spot prices;
- DRAM contract prices;
- NAND prices;
- HBM pricing;
- Enterprise‑SSD prices;
- HDD pricing.
Spot prices can be affected by short‑term trading, while contract prices may better reflect actual purchasing terms between large customers and manufacturers.
Underlying Corporate Earnings
Focus on:
- Samsung’s semiconductor profits;
- SK hynix’s operating profit;
- Micron’s revenue and gross margin;
- Seagate and Western Digital’s data‑center revenue;
- HBM revenue mix;
- DRAM and NAND average selling prices;
- Management guidance for the next quarter.
Earnings data must be compared with market expectations. Earnings growth does not guarantee a rising stock—if actual results fall short of previous optimistic expectations, the ETF can still decline.
AI Demand
Watch:
- NVIDIA and other AI GPU shipments;
- Hyperscaler capital expenditure;
- AI server growth;
- HBM demand forecasts;
- HBM capacity per GPU;
- AI inference demand;
- Data‑center storage capacity;
- Enterprise AI adoption.
Industry Inventory
Inventory Days are a key indicator of the Memory Cycle.
Declining inventories typically mean customers are absorbing previously built‑up chips, and supply/demand may be improving.
But inventory must be assessed alongside end‑demand. If inventories fall mainly because manufacturers have slashed production while end‑demand remains weak, the recovery may lack sustainability.
Capital Expenditure
When Samsung, SK hynix, and Micron increase capex, it can signal confidence in future demand.
But capex eventually translates into more capacity.
If all manufacturers ramp up quickly at the same time, future supply growth may depress DRAM, NAND, and HBM prices.
So capex can be both a confidence indicator and a leading indicator of future supply risk.
ETF Valuation and Token Pricing
Price predictions also require checking:
- Roundhill Memory ETF valuation;
- Underlying constituents’ P/E ratios;
- Cycle‑adjusted earnings;
- How much AI growth expectation is already priced in;
- Whether DRAMON trades at a premium;
- Whether the token market has sufficient depth.
“Can DRAMON reach $100?” is not a question that can be answered without reference to the underlying ETF.
If DRAMON reaches $100, you must first assess whether the Roundhill Memory ETF itself is near that corresponding value and whether the token has developed an abnormal premium.
10. DRAMON Investment Strategies: Short‑Term, Swing, and Long‑Term Approaches
Short‑Term Strategy: Trade Memory and AI Events
Short‑term traders can watch:
- Samsung earnings;
- SK hynix earnings;
- Micron earnings;
- NVIDIA earnings;
- HBM customer qualifications;
- DRAM price moves;
- AI server orders;
- Fed interest rates;
- ETF opening performance;
- DRAMON volume and premium/discount.
The core principle for short‑term trading is:
Do not chase a rally just because DRAMON appears on the gainers’ list, without checking the underlying ETF price and market depth.
If the underlying ETF is closed and DRAMON spikes on an AI headline, you need to assess whether it is a genuine expectation adjustment or a temporary premium caused by thin liquidity.
Swing Strategy: Track the Memory Cycle
Swing investors need to monitor the full sequence:
Industry inventories decline → DRAM prices stabilize and then rise → earnings expectations begin to upgrade → equities and the ETF may rally in advance → actual earnings later confirm the cycle improvement.
Memory stocks often lead fundamentals.
When reported profits are at their worst, the market may already be pricing the next recovery; when company profits are at historical highs, the market may also be worried about capacity expansion and price reversals.
Therefore, swing judgments cannot rely only on the latest quarterly profits. You must also gauge:
- Inventory direction;
- Storage price changes;
- Capacity plans;
- Customer purchasing;
- Market expectations;
- ETF valuation.
Long‑Term Strategy: Bet on Structural Memory Demand Growth in the AI Era
The long‑term thesis can rest on these trends:
- AI models growing larger;
- Increasing GPU deployments;
- More HBM required per GPU;
- Expanding AI inference services;
- Growing number and scale of data centers;
- Rising enterprise storage demand;
- Global data volume increasing over time;
- A rising share of high‑end memory products.
But long‑term investors must simultaneously monitor supply.
If memory manufacturers’ capacity grows faster than demand over time, even with AI development continuing, memory companies may fail to earn desirable profits due to falling prices.
Long‑term demand growth and long‑term investment returns are not the same thing. Entry valuation, industry competition, and supply discipline are equally important.
11. When Does DRAMON Deserve More Attention? When Should You Be Cautious?
This article does not provide a uniform buy price, but it can establish a research framework.
Relatively Favorable Phases
When the following conditions coincide, DRAMON’s industry environment may be relatively supportive:
- Memory inventories continue to decline;
- DRAM prices bottom and enter an uptrend;
- HBM demand exceeds supply;
- AI server shipments increase;
- Major cloud providers raise AI capex;
- Earnings expectations for Samsung, SK hynix, and Micron are upgraded;
- Companies are not over‑expanding;
- The Roundhill Memory ETF valuation remains reasonable;
- DRAMON shows no significant premium;
- The token market has sufficient trading depth.
Phases Requiring Caution
The following signals may indicate rising risk:
- DRAM prices have already risen sharply for a sustained period;
- Underlying memory companies’ valuations have expanded noticeably;
- Market expectations are overly optimistic;
- Samsung, SK hynix, and Micron all substantially increase capacity simultaneously;
- Customer inventories begin to rise again;
- AI capex growth decelerates;
- HBM prices show signs of expected decline;
- ETF trading volume and fund flows weaken;
- DRAMON trades at a severe premium to the underlying ETF;
- Token market depth declines noticeably.
The industry may still be growing, but that does not mean prices won’t correct.
If valuations have already priced in too much future demand, even a slight miss on actual results can trigger repricing.
12. Why Might DRAMON Suit Some Investors Better Than a Single Memory Stock?
DRAMON offers a portfolio of multiple companies through the Roundhill Memory ETF.
The main advantage is reducing company‑specific risk.
Holding a single memory company can expose you to:
- Technology‑roadmap failure;
- HBM qualification delays;
- Loss of a major customer;
- Yield shortfalls;
- Market‑share loss;
- Management missteps;
- Country‑specific policy risks;
- Corporate governance issues.
An ETF holds multiple companies, so problems at one constituent may be partially cushioned by others.
DRAMON vs. Samsung Single Stock
Samsung’s business is more diversified—beyond memory, it includes mobile, displays, consumer electronics, and foundry.
Holding Samsung directly gives you exposure to the entire company, but the memory‑theme purity is lower than that of the DRAM ETF.
DRAMON vs. SK hynix Single Stock
SK hynix is more concentrated in DRAM, NAND, and HBM, and may offer higher earnings leverage to AI memory and the storage cycle.
If SK hynix maintains HBM leadership, a direct holding could offer stronger upside.
But if technology, customer, or capacity issues arise, the company‑specific risk is also more concentrated.
DRAMON vs. Micron Single Stock
Micron is a major U.S. memory company whose public earnings and management guidance provide clear industry‑observation windows.
But holding Micron alone still carries single‑company, U.S.‑market valuation, and execution risks.
What Is the Cost of Diversification?
An ETF diversifies company risk, but it also diversifies returns.
If one HBM leader rallies sharply while other constituents lag, the ETF’s return may be lower than holding that single company.
That is the trade‑off between diversification and concentration:
Concentration increases potential return leverage, but also magnifies losses from a single wrong call. Diversification reduces company‑specific risk, but may also lower returns from picking the industry winner.
13. What Are the Differences Between DRAMON, BTC, and ETH?
DRAMON, BTC, and ETH are all accessible through crypto markets, but their value sources are entirely different.
DRAMON’s core value comes from the Roundhill Memory ETF and its underlying storage companies.
BTC is primarily driven by the Bitcoin network, fixed supply, market demand, macro liquidity, and asset‑allocation trends.
ETH is tied to Ethereum network usage, gas fees, staking, smart contracts, and on‑chain application ecosystems.
Therefore, you cannot use the same valuation framework for all three.
Investors can consult BTC price prediction and market cycles to gauge overall crypto‑market risk appetite.
You can also reference ETH price prediction and Ethereum trends to judge on‑chain finance and RWA market activity.
But it is important to be clear:
A BTC rally does not directly boost Samsung, SK hynix, or Micron’s operating profits.
BTC and ETH mainly affect DRAMON indirectly through:
- Crypto‑market liquidity;
- USDT aggregate size;
- Trader risk appetite;
- CEX trading volume;
- Demand for on‑chain assets;
- DRAMON secondary‑market premiums or discounts;
- Market deleveraging.
So BTC and ETH are trading‑environment variables for DRAMON, not primary fundamental variables for the underlying ETF.
14. How Does DRAMON Differ from ATC, DN, CAP, and RIF?
When investors see a new ticker, the first step should not be to ask whether it will go up, but to confirm:
What is the underlying value of this asset?
Assets in the market can be categorized as:
- Crypto‑native project tokens;
- Meme coins;
- DeFi governance or utility tokens;
- Stablecoins;
- RWAs;
- Tokenized stocks;
- Tokenized ETFs;
- Derivatives;
- Yield‑bearing assets.
Different categories require different valuation methods.
DRAMON Is a Tokenized ETF
For DRAMON, the core analytical metrics are ETF NAV, underlying holdings, the Memory Cycle, corporate earnings, and token premium/discount.
When researching other new assets—such as what is ATC—you should also first identify its project nature, underlying value, and token utility before deciding which analytical framework to apply.
Just because two assets can both trade against USDT does not mean they carry the same risks.
DRAMON and DN Have Different Valuation Frameworks
When researching what is DN, investors may need to focus on project mechanics, token supply, value capture, user adoption, and community factors.
But you cannot directly apply FDV, token unlocks, and community hype to analyze DRAMON.
For DRAMON, you should instead watch:
- ETF NAV;
- Underlying constituents;
- Memory‑company earnings;
- DRAM and HBM prices;
- Premium and discount;
- Issuance and redemption structure.
DRAMON and CAP Have Different Risk Sources
Through what is CAP, investors can further understand the differences between crypto‑native projects and RWA products.
DRAMON’s first layer of risk is traditional financial asset price risk—i.e., declines in the Roundhill Memory ETF and its underlying constituents.
The second layer is tokenization infrastructure risk, including issuance, custody, on‑chain liquidity, and regulation.
Core risks for ordinary crypto projects may lie more in product adoption, tokenomics, smart contracts, and team execution.
Don’t Compare DRAMON and RIF by Returns Alone
When reading introductions like what is RIF, you should not simply compare which ticker has risen faster recently.
More relevant dimensions include:
- Underlying asset;
- Source of value;
- Value capture mechanism;
- Valuation model;
- Liquidity;
- Volatility drivers;
- Supply structure;
- Regulatory structure;
- Maximum risk.
Whether DRAMON suits you depends on whether you want memory‑industry exposure—not on which token has had higher short‑term returns.
15. How to Buy DRAMON—Using Hibt’s DRAMON/USDT as an Example
DRAMON/USDT means using USDT as the quote currency to trade DRAMON.
The basic process is as follows.
Register or Log In to Hibt
Go to the platform, complete account registration, security verification, and the required identity authentication.
We recommend enabling two‑factor authentication and never sharing your password, verification codes, private keys, or mnemonic phrases with anyone.
Prepare USDT
Users can acquire USDT through supported methods on the platform, or deposit from other wallets or platforms.
Before depositing, verify:
- The deposit network;
- The deposit address;
- Minimum deposit amount;
- Whether a Memo or Tag is required;
- Whether the network is operating normally.
Selecting the wrong network may result in funds not being credited.
Search for DRAMON/USDT
Go to the relevant trading section and search for DRAMON or DRAMON/USDT.
You can check the latest price, volume, and changes via DRAMON real‑time price and market data.
Check Order‑Book Depth
Do not look only at the last traded price. Also check:
- Best bid and best ask;
- Bid‑ask spread;
- 24‑hour trading volume;
- Order‑book depth;
- Estimated slippage for large orders;
- Platform deposit and withdrawal status.
Compare with the Roundhill Memory ETF Reference Price
This is a crucial step before trading a tokenized ETF.
Ondo’s publicly stated relationship is 1 DRAMON = 1 DRAM. Investors can compare:
- The Roundhill Memory ETF’s latest price;
- DRAMON’s current price;
- Whether the underlying market is open;
- Data update time;
- Whether there is a significant spread.
Evaluate Premium or Discount
If DRAMON trades significantly above the underlying ETF’s reference value, buyers may bear the risk of premium mean‑reversion.
If DRAMON trades at a clear discount, do not automatically assume a risk‑free arbitrage exists. The discount could stem from thin liquidity, redemption restrictions, regional eligibility, platform risks, or market concerns about the issuance structure.
Use Limit Orders or Market Orders
Limit orders allow you to set your desired execution price, but they are not guaranteed to fill.
Market orders execute quickly, but may incur significant slippage when market depth is thin.
For tokenized ETFs—especially when U.S. equities are closed or DRAMON spreads are wide—limit orders are generally better for controlling execution price.
16. The Ten Biggest Risks of Investing in DRAMON
Memory Cycle Reversal Risk
Falling DRAM and NAND prices can significantly compress underlying corporate profits.
HBM Demand Below Expectations
If AI server shipments or per‑GPU HBM demand disappoint, memory‑company valuations may be marked down.
Supply Glut Risk
If Samsung, SK hynix, and Micron expand capacity too quickly, future supply may outstrip demand.
AI Valuation Bubble Risk
Even if the AI industry grows long‑term, overvalued assets can still correct sharply.
ETF Concentration Risk
The Roundhill Memory ETF is concentrated in memory and storage themes, with limited industry diversification.
Single‑Industry Risk
An economic downturn, falling end‑demand, or technological shifts could affect multiple constituents simultaneously.
Token Issuance and Custody Risk
Ondo’s pages disclose mechanisms like Security Interest in Collateral, Bankruptcy Remote, and Attestation—but these arrangements do not mean investment risk is zero.
Investors still need to understand:
- Who holds the collateral assets;
- How assets are segregated;
- Attestation frequency;
- What happens if the issuer faces problems;
- Whether token holders have direct recourse;
- Which users can redeem.
Liquidity Risk
DRAMON’s own trading size may be substantially smaller than that of the Roundhill Memory ETF.
Even if the underlying ETF has normal liquidity, the DRAMON market may still show wide spreads and slippage.
Premium and Discount Risk
When equities are closed, redemptions are restricted, or crypto‑market capital flows are unbalanced, the token may temporarily deviate from the underlying reference value.
Regulatory and Regional Restrictions
Ondo’s tokenized stock and ETF products have regional and investor‑eligibility restrictions—not all users globally can mint, redeem, or trade.
Regulatory changes can also affect product availability, platform support, and token transfer rules.
17. Is DRAMON Worth Investing In? Build a Judgment Model with Seven Indicators
Whether DRAMON is worth investing in cannot be answered with a simple "yes" or "no."
Investors can use seven indicators to build their own framework.
DRAM Price Trend
Watch whether DRAM spot and contract prices are rising, falling, or flat.
Price trends should be assessed alongside inventory and supply—not just one week’s move.
HBM Demand
Check whether AI server shipments, GPU supply, HBM orders, and customer qualifications continue to grow.
Industry Inventory
Monitor whether inventories at Samsung, SK hynix, Micron, and customers are declining.
Inventory drawdowns generally support price recovery, but real end‑demand must back them.
Corporate Earnings
Analyze whether operating profits, gross margins, cash flow, and management guidance at underlying memory companies are consistently improving.
Capital Expenditure
Confirm whether manufacturers are over‑expanding.
Strong short‑term demand and long‑term oversupply can happen at the same time.
ETF Valuation
Assess whether the Roundhill Memory ETF and its underlying companies have already priced in too much AI growth.
A great industry outlook does not make any valuation reasonable.
DRAMON Premium/Discount
Check whether the token price has decoupled from the underlying ETF’s reference value.
Even if your industry thesis is correct, buying into an excessive premium can still lead to poor investment results.
Ultimately, you can form a five‑layer analytical framework:
AI Demand × Memory Cycle × Corporate Earnings × Industry Valuation × Token Pricing.
Only when all five layers are validated can you more fully assess DRAMON’s current risks and potential opportunities.
18. DRAMON FAQ
What is DRAMON?
DRAMON is a tokenized ETF within the Ondo Global Markets system, with the Roundhill Memory ETF as its underlying asset.
What coin is DRAMON?
DRAMON exists in blockchain‑token form, but it is not a typical crypto project coin. Its core value comes from the economic performance of the underlying Memory ETF.
What is DRAMON USDT?
DRAMON/USDT is the trading pair that uses USDT as the quote currency for DRAMON.
What is the relationship between DRAMON and the DRAM ETF?
Ondo’s public page shows that 1 DRAMON equals 1.00 DRAM. DRAM is the traditional‑market ticker for the Roundhill Memory ETF.
Is DRAMON an ETF?
DRAMON is an ETF‑related tokenized asset that provides economic exposure to the Roundhill Memory ETF, but its holding structure is not entirely identical to holding ETF shares in a traditional brokerage account.
Is DRAMON a stock?
No, it is not a single‑company stock. It corresponds to an ETF built around the global memory and storage industry.
Why is DRAMON rising?
Possible reasons include: a rise in the Roundhill Memory ETF, improving DRAM prices, growing HBM demand, rallies in underlying constituents, strong AI‑server sentiment, and changes in DRAMON’s own liquidity or premium.
Is DRAMON worth investing in?
You need to simultaneously assess the Memory Cycle, AI demand, corporate earnings, industry valuation, ETF structure, and DRAMON’s premium/discount—you cannot judge based on the AI concept alone.
Is DRAMON suitable for long‑term holding?
The long‑term thesis mainly comes from structural growth in memory demand in the AI era, but investors must still monitor supply expansion, industry cycles, and tokenized‑ETF structural risks.
How do you buy DRAMON?
You can buy DRAMON with USDT on platforms that support the DRAMON/USDT pair. Before buying, compare DRAMON’s price with the Roundhill Memory ETF’s reference price.
What determines DRAMON’s price?
In the medium to long term, it is determined primarily by the Roundhill Memory ETF and the performance of its underlying companies. In the short term, token‑market liquidity, premium, and discount also play a role.
Can DRAMON be traded 24/7?
Trading hours depend on the platform. Eligible Ondo users may have 24/5 mint/redemption access, but that does not mean the underlying ETF or all trading scenarios are 24/7.
Does DRAMON pay dividends?
The underlying ETF may receive dividends from its constituents, but how DRAMON holders receive that economic benefit depends on the product’s dividend, fee, and NAV‑treatment rules. Do not assume the token will pay cash dividends like a brokerage account—refer to Ondo’s latest documents.
Does HBM upside benefit DRAMON?
Rising HBM prices and demand may improve earnings expectations for underlying memory companies, which can benefit the ETF. But the actual impact depends on weights, market share, costs, and current valuations.
Does DRAM price increases affect DRAMON?
Likely yes. Rising DRAM prices generally boost memory‑company revenue and profits, but the market may have already priced in those expectations.
What is the difference between DRAMON and buying SK hynix directly?
DRAMON holds multiple memory and storage companies through an ETF, diversifying single‑company risk. Holding SK hynix directly is more sensitive to its HBM performance and company‑specific events.
What is the biggest risk of DRAMON?
Major risks include Memory Cycle reversal, weaker‑than‑expected HBM demand, excessive manufacturer capacity expansion, AI valuation declines, ETF industry concentration, token custody and issuance structure, illiquidity, premium/discount, and regional restrictions.
19. Conclusion: Investing in DRAMON Is Essentially Betting on How Much Memory the AI Era Will Need
Although DRAMON exists in token form in crypto markets, its long‑term value core is not blockchain narratives—it is the global storage industry behind the Roundhill Memory ETF.
The full value‑transmission chain is:
AI companies expand model training and inference → cloud providers increase data‑center capex → data centers purchase more GPUs and AI servers → AI accelerators need larger‑capacity, higher‑bandwidth HBM → servers and cloud platforms also need more DRAM, SSDs, and HDDs → memory and storage companies receive new orders → demand, inventory, and supply jointly determine DRAM, NAND, and HBM prices → price changes affect earnings of Samsung, SK hynix, Micron, and others → underlying company performance affects the Roundhill Memory ETF → ETF value and token‑pricing mechanisms ultimately influence DRAMON’s price.
But this chain does not only go up.
If Samsung, SK hynix, and Micron expand capacity faster than demand, memory prices can still fall; if AI capex decelerates, HBM growth expectations may be revised down; if the underlying ETF already embeds too much optimism, even earnings growth may not prevent price corrections.
DRAMON investors also take on additional layers:
- Ondo’s tokenization structure;
- Underlying asset custody;
- Minting and redemption restrictions;
- Token liquidity;
- Premium and discount;
- Regional regulatory risk.
Therefore, analyzing DRAMON should not use meme‑coin methods, nor should you watch only crypto gainers.
A more sensible investment framework is:
AI Infrastructure + Memory Cycle + ETF Fundamentals + RWA Pricing Mechanism.
The real question is not whether DRAMON carries AI, HBM, and RWA labels—but:
How much memory will AI servers actually need? Can HBM demand growth continue? Will storage companies over‑expand? How much future growth is already priced into current ETF valuations? And does DRAMON accurately reflect the underlying ETF’s value?
Only by following this order of research can investors more objectively judge whether DRAMON fits their investment horizon, risk tolerance, and asset‑allocation goals.
Disclaimer: This article is based on publicly available information and is for educational and reference purposes only. It does not constitute investment advice, an offer, or a solicitation. Cryptocurrencies are high‑risk assets with extreme price volatility. Please conduct your own independent research (DYOR) before making any decisions and comply with the laws and regulations of your jurisdiction.