
EMBER is the ecosystem token of EmberCurve on Solana. EmberCurve is not a tokenized stock. It is a token issuance platform built on Meteora liquidity infrastructure: creators can use Dynamic Bonding Curve to issue new tokens, choose SOL, USDC, EMBER, meme tokens, or tokenized stocks such as NVDAx and AAPLx as the quote asset, and decide whether trading fees go to holder rewards, buybacks and burns, permanent liquidity, or other modules.
HIBT opened EMBER/USDT trading on September 23, 2026. The network is Solana, and the correct contract address is:
5dvXTZ5qwgafnHtwu3Ls3QrWx1U4LQsFeCuJgkk4QEC6
The real question for EMBER investors is not which new meme will explode. It is whether EmberCurve can keep attracting creators and traders, and how much of the volume and fees generated by the platform ultimately converts into EMBER buybacks, burns, pairing demand, and long-term value.
As of September 30, 2026, EmberCurve’s official page describes its pairing universe as more than 1,200 Meteora-recognized assets and tokenized stocks. CoinGecko shows EMBER’s circulating supply at roughly 989 million tokens, with market cap and price experiencing sharp volatility shortly after launch. This shows the product has already attracted market attention, but the token is still in an early stage of price discovery and business model validation.
Readers can check the latest price, volume, and order book through EMBER live price and EMBER/USDT market data. This article is for project research and risk education only. It is not investment advice or a promise of returns.
Key Takeaways: 9 Things to Know Before Investing in EMBER
- EMBER runs on Solana. You cannot confirm an asset by name alone. Always verify the contract address before trading.
- EmberCurve is a launchpad. EMBER is its ecosystem token. They are not the same product.
- EmberCurve primarily uses Meteora’s DBC and DAMM v2 infrastructure. It has not built a complete AMM from scratch.
- EMBER is not a stock token. Pairing with NVDAx or AAPLx does not mean EMBER is backed by stocks.
- New tokens first go through price discovery in a Bonding Curve and may migrate to formal liquidity pools only after reaching a threshold.
- Different projects can choose different tax rates and Fee Modules. There is no fixed allocation ratio that applies to all tokens.
- EmberCurve platform volume does not equal income for EMBER holders. You must keep tracking the value capture path.
- Launch count is only an activity indicator. Graduation rate, 30-day survival rate, and post-graduation liquidity better reflect quality.
- EMBER is best studied through a three-layer framework: platform growth, token value capture, and market valuation—not by looking only at the gainers list.
1. What Is EMBER/USDT? The Basics in 300 Words
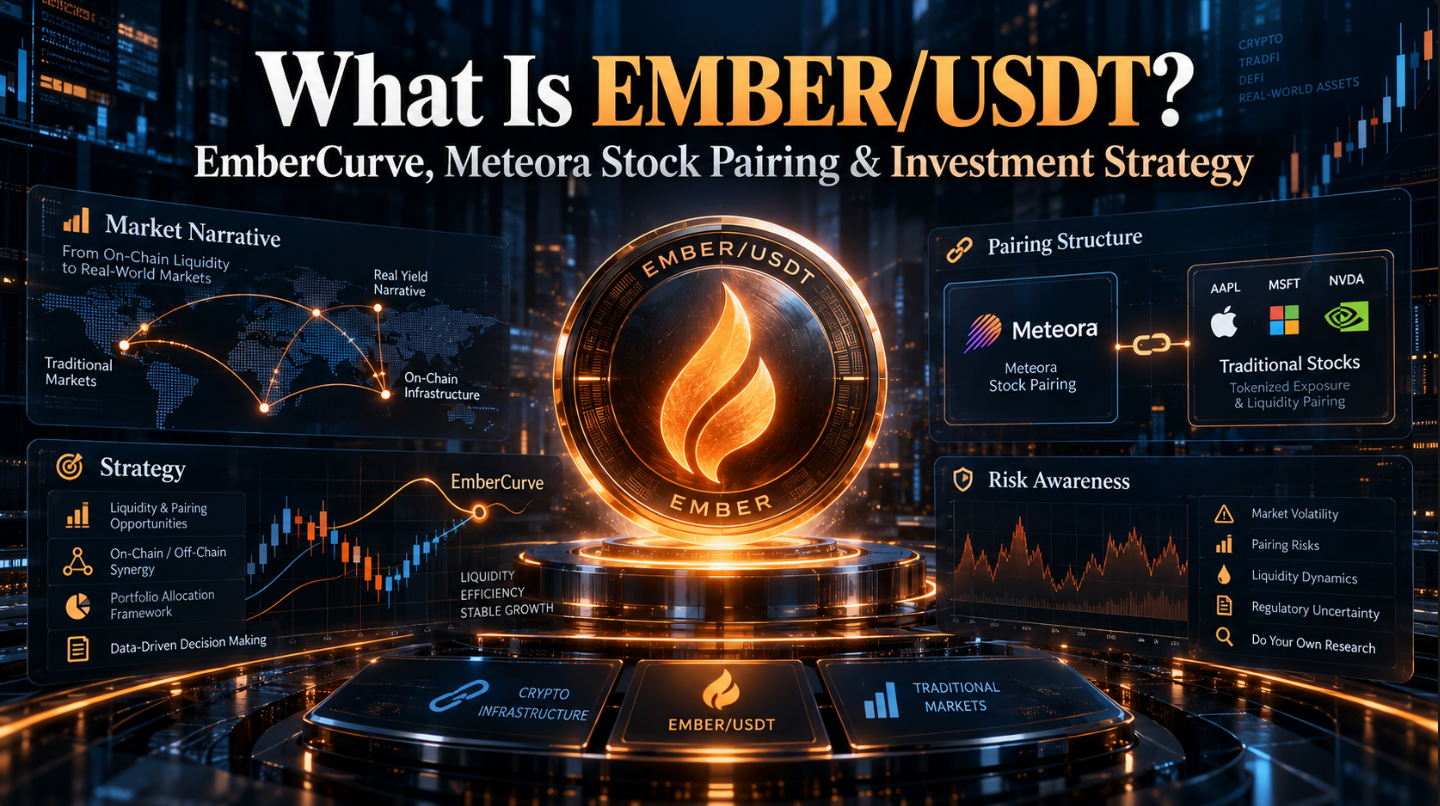
EMBER is the ecosystem token of the EmberCurve project, issued on Solana. According to HIBT’s announcement, EMBER/USDT opened for trading on September 23, 2026, at 04:00 UTC, which is 12:00 Beijing time. The network is listed as SOL.
USDT in EMBER/USDT is the quote asset. For example, if EMBER/USDT is 0.01, it means the market is pricing one EMBER at about 0.01 USDT. This is only a trading pair relationship. It does not mean USDT provides fixed collateral for EMBER’s price.
EmberCurve is a token issuance and liquidity creation platform. Creators can choose a token name, pairing asset, Bonding Curve graduation threshold, and Fee Module on the platform, then use Meteora infrastructure to complete issuance, trading, and post-graduation liquidity migration.
So the more accurate positioning is:
EMBER is a high-risk token evolving from a launch meme into a Launchpad ecosystem asset; EmberCurve is the platform that handles issuance, pairing, and fee routing.
It is not surprising that some trading platforms initially classified EMBER as a meme category, because it launched recently and its price is highly influenced by community and speculative sentiment. But based on current product functionality, calling it just an ordinary meme coin is also inaccurate. A more balanced description is: EMBER has a real Launchpad product narrative, but it cannot yet be called a mature DeFi infrastructure token.
2. How Are EMBER, EmberCurve, and Meteora Related?
These three layers are often mixed together in ordinary introductory articles.
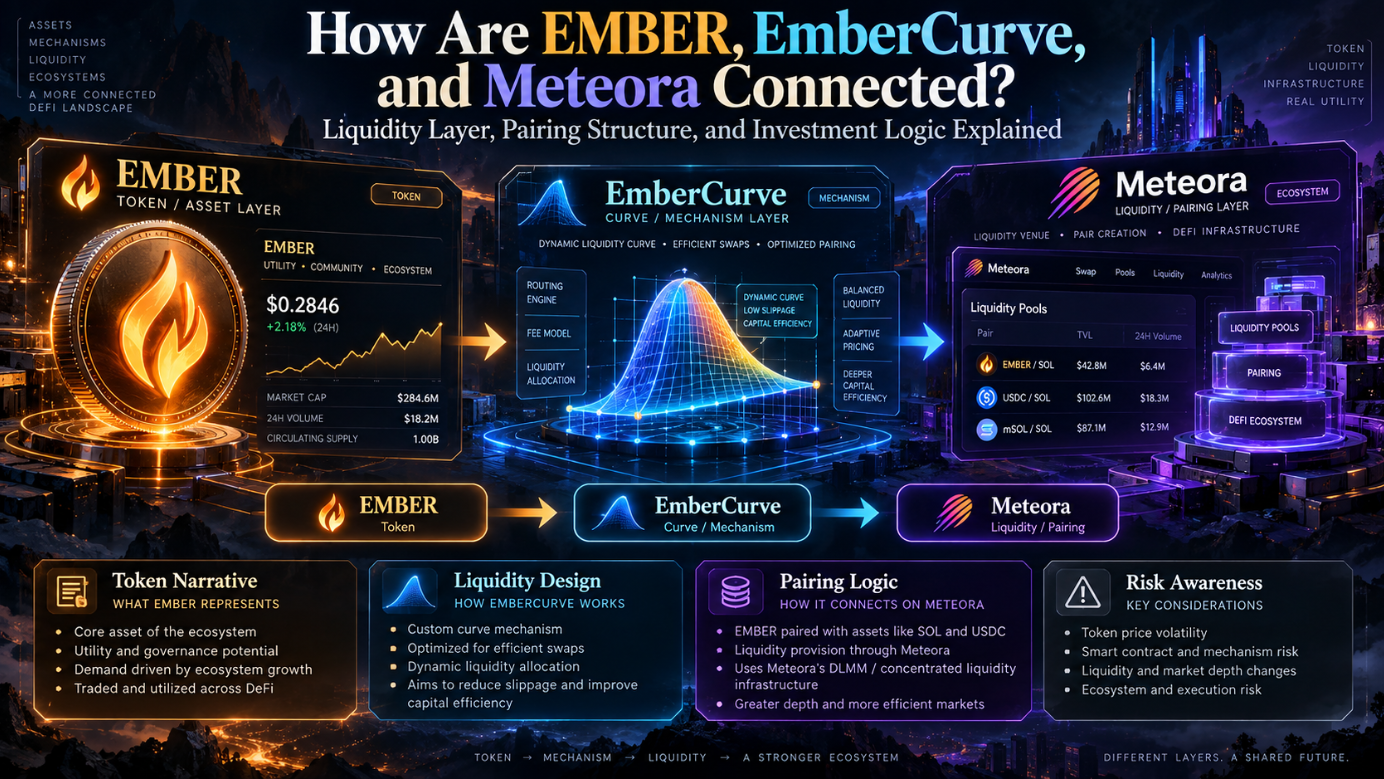
EMBER is the token. It carries roles such as ecosystem branding, market trading, part of pairing demand, and being the object of buybacks and burns.
EmberCurve is the application layer. It provides the user interface and product logic for creating tokens, choosing quote assets, configuring fee modules, discovering markets, and viewing rewards.
Meteora is the underlying liquidity infrastructure. Meteora’s official documentation describes Dynamic Bonding Curve as a customizable virtual price curve. After a token reaches a minimum Quote Threshold, it can migrate to a Meteora DAMM v1 or DAMM v2 liquidity pool.
The full path can be summarized as:
Creator enters EmberCurve → configures new token and quote asset → uses Meteora DBC for early trading → reaches graduation threshold → migrates to DAMM v2 → enters ongoing DEX trading phase.
This also means EmberCurve has a Meteora dependency. Meteora’s contract security, network availability, migration rules, and liquidity experience all affect tokens on EmberCurve. Conversely, having a product and users does not mean EmberCurve owns Meteora protocol revenue or control.
3. What Is a Dynamic Bonding Curve? Why Can Early Prices Rise So Fast?
A Bonding Curve can be understood as an automatic curve where contract rules determine token prices. When a new token is first issued, it does not necessarily enter a traditional order book first, nor does it immediately have a mature AMM pool. Users’ buys and sells change the reserves and price in the curve.
When more capital enters, Curve Progress rises, and later buyers may pay higher prices than early buyers. Conversely, heavy selling can also cause prices to fall quickly. Therefore, new tokens in the Bonding Curve phase often show these characteristics:
- Very fast early price discovery;
- Large differences in average cost between buyers and sellers;
- Small amounts of capital can cause significant volatility;
- Concentrated speculation tends to appear near the graduation threshold;
- Rising prices do not mean the project has formed long-term demand.
Investors cannot only see “early buying price is low.” They must also consider the cost advantage of early wallets. When later liquidity increases, early holders may have a strong ability to realize profits.
4. What Does Token “Graduation” Mean? Why Isn’t It the Same as an Exchange Listing?
Graduation in EmberCurve is usually an on-chain liquidity event, not a centralized exchange listing.
After a new token reaches a preset Quote Threshold in the DBC phase, the relevant assets and liquidity migrate to a Meteora DAMM pool according to the rules. After migration, the token enters a relatively conventional DEX liquidity trading phase.
Therefore:
Graduation ≠ listing on HIBT, Binance, or another CEX.
Graduation proves that a new token completed one issuance phase transition, but it does not prove it has a stable community, sustained volume, or long-term value. What really needs to be observed after graduation is:
- Whether liquidity depth is sufficient;
- Whether trading volume can be maintained;
- Whether the number of holders is growing;
- Whether LPs are stable;
- Whether slippage on large trades declines;
- Whether there is still real trading after 30 days.
You can establish a more effective metric than “graduation count”:
30-day survival rate = number of projects with effective trading and liquidity 30 days after graduation ÷ total graduated projects.
A launchpad can manufacture many graduation projects, but if the vast majority quickly go to zero, launch count is just a vanity metric.
5. Why Can EmberCurve Pair with Stock Tokens Like NVDAx and AAPLx?
One of EmberCurve’s most differentiated features is allowing creators to choose quote assets from a large set of Solana assets and tokenized stocks. As of September 30, 2026, the official page shows the platform can choose from more than 1,200 Meteora-recognized assets and stock tokens for pairing.
Traditional meme launchpads commonly use:
New Token/SOL, or New Token/USDC.
EmberCurve can form:
GPU-themed Token/NVDAx, auto-themed Token/TSLAx, tech-themed Token/AAPLx.
This type of structure combines crypto narratives with RWA price exposure in the same market, creating what can be called Stock-Meme or cross-asset narratives. Its product innovation is mainly in market structure, quote assets, and reward settlement methods—not in giving new tokens stock ownership.
It must be specifically noted:
Pairing with NVDAx does not mean the new token is collateralized by NVIDIA stock, nor does holding that token make you an NVIDIA shareholder.
If GPUCAT forms a trading pool with NVDAx, it only means GPUCAT uses NVDAx for pricing and liquidity. Investors need to separately study GPUCAT, NVDAx’s issuance structure, and the trading pool risk. They cannot assume real stock backing just because a stock ticker appears in a trading pair.
6. Is EMBER a Tokenized Stock? Do Stock Pairs Have Real Value?
EMBER is not a tokenized stock. It does not correspond to any listed company, nor does it represent stock, ADR, or ETF shares. Its value mainly comes from EmberCurve ecosystem expectations, market supply and demand, buybacks and burns, and potential pairing demand.
Stock token pairing can still have product value, mainly in four areas.
First, creators can build themed markets around specific companies or industries that are easier to understand.
Second, the quote asset itself may create exposure related to stock prices, so traders are not only facing SOL or USDC quotes.
Third, some Fee Modules can use the quote asset for rewards. If the quote asset is a stock token, the market performance of the reward may be related to the corresponding stock asset.
Fourth, more quote assets can increase market combinations and routing options.
But these values must be validated by real trading volume. If there are many stock pairs but volume, independent traders, and liquidity remain low for a long time, then “RWA Launchpad” is still mainly a narrative, not scaled user demand.
7. Why Does the Quote Asset Matter? Rewards Aren’t Always EMBER
The quote asset is the other side asset that provides pricing and liquidity for a new token.
If a token is paired with SOL, buying, selling, and some fees may settle in SOL. When paired with USDC, the relevant value may be denominated in USDC. When paired with MET or a stock token, rewards and liquidity assets may also change accordingly.
This creates an easily overlooked distinction:
The token a user holds and the asset ultimately distributed by the Fee Module are not necessarily the same token.
For example, if a project chooses Holder Rewards and uses MET as the quote asset, eligible holders may receive MET, not EMBER. If a project is paired with a stock token, rewards may also settle in that quote asset.
Therefore, when you see “holding rewards,” you should check at least four things:
- Which Fee Module the reward comes from;
- What the reward asset is;
- Which wallets meet the claim conditions;
- Whether the current allocation rules can be changed by governance.
Simply holding EMBER in a HIBT account also does not automatically qualify you for all Holder Rewards on EmberCurve.
8. How Does EmberCurve’s Fee Routing Actually Work?
EmberCurve makes “where trading fees go” part of the Launchpad product. Creators not only choose what token to issue, but also how fees are allocated.
The current market page displays modules including Holder Rewards, Buyback & Burn, EMBER Booster, Deep Pool, Conviction, Predict, SuperLotto, and Dip Defender. Different tokens can use different tax rates, Holder Share, and Creator Side uses.
So you cannot continue to use unified statements like “every project gives 80% to holders” or “all platform fees buy back EMBER.”
A more accurate analysis method is to check each token individually:
Actual trading volume → actual Tax → Holder Side and Creator Side → corresponding Fee Module → final on-chain payment, buyback, or liquidity operation.
EmberCurve’s current “How it works” and market pages show that fee shares and specific uses change with project configuration and governance. No yield rate should be assumed permanent, and the allocation ratio on one project page cannot be applied to the entire platform.
9. What Problems Do Holder Rewards, Buyback & Burn, and Deep Pool Solve?
Holder Rewards: Distributing Part of Trading Fees to Eligible Wallets
This model attempts to connect trading activity with holder rewards. Users need to check Eligible Holders, Pending Rewards, historical payment records, and the Quote Asset—not just the percentage advertised on a promotional page.
The risk is that rewards depend on continued trading. Without volume, there are not enough fees to distribute. High tax rates can also increase trading costs and suppress volume.
Buyback & Burn: Using Designated Fees to Buy Back and Burn Tokens
This can reduce token supply, but “there is burning” does not mean the burn size is enough to support valuation. Investors should calculate the burn amount relative to total supply and market cap.
Deep Pool: Adding Part of Fees Back into Liquidity
Deep Pool attempts to create the following cycle:
Trading volume → fees → add permanent liquidity → reduce slippage → improve trading experience → attract more volume.
This mechanism is more observable than simply promising locked liquidity, but it still cannot guarantee price increases. If there are no new buyers, deeper liquidity only improves trading conditions; it cannot create real demand.
10. Why Do High Platform Fees Not Equal High EMBER Holder Earnings?
This is the most important concept in analyzing EMBER.
The economic activity generated by EmberCurve needs to be broken into at least three layers.
The first layer is Platform Economic Activity: volume, trading fees, and launch activity across all markets.
The second layer is User and Creator Payouts: assets distributed to project holders, creators, lotteries, liquidity modules, or other purposes.
The third layer is EMBER Value Capture: the portion actually used for EMBER buybacks and burns, EMBER pairing, and other activities that can increase EMBER demand.
Suppose EmberCurve has $1 million in daily volume. That does not mean EMBER receives $1 million in revenue. You must confirm in order:
How much Gross Fees does $1 million in volume generate → how much belongs to the platform or creator side → how much enters EMBER-related modules → how much EMBER is ultimately bought, burned, or locked into pairing liquidity.
Therefore:
Platform Success ≠ Token Success.
A platform can have many users and projects, but if most fees flow to other token holders or creators, EMBER’s value capture may still be weak.
11. How Should You View EMBER Buybacks and Burns? Is Burning 1 Million Tokens a Lot?
EmberCurve’s official page already displays EMBER Buyback & Burn and related ecosystem modules, but analysis cannot stop at “cumulative burn is large.”
CoinGecko data around September 29, 2026 placed EMBER’s circulating supply at about 989 million tokens. Assuming cumulative burns of 1 million tokens, that is about 0.1% of a 1 billion supply. This number has directional meaning, but it may not be enough on its own to change supply-demand dynamics.
Two more effective metrics are:
Burn Rate = cumulative EMBER burned ÷ initial or baseline supply.
Buyback Yield = annualized EMBER buyback amount ÷ EMBER market cap.
For example, if annual real buybacks are $1 million and EMBER’s market cap is $10 million, the nominal Buyback Yield is about 10%. If market cap reaches $100 million, the same buyback amount is only about 1%.
When calculating, also distinguish:
- Whether tokens are truly bought from the market and burned, or whether project-reserved tokens are burned;
- Whether buyback funds come from sustainable fees or short-term subsidies;
- Whether on-chain transactions can be verified;
- Whether buyback speed slows significantly as volume declines.
Deflationary mechanisms only have stronger valuation significance when the amount, source, and sustainability are all verifiable.
12. Why Might EMBER as a Quote Asset Be More Important Than Buybacks and Burns?
Markets using EMBER as a quote asset have already appeared on EmberCurve. If more new tokens need to prepare EMBER to establish initial liquidity, EMBER may form embedded demand.
The value chain is:
New project chooses Token/EMBER pair → creators and LPs need EMBER → part of EMBER enters liquidity pools → market trading continues to generate EMBER-related demand.
You can establish an original metric:
EMBER Pair Share = effective trading volume with EMBER as quote asset ÷ total EmberCurve trading volume.
If this ratio rises sustainably from 5% to 15% or 30%, it indicates EMBER is gradually becoming an internal liquidity asset in the ecosystem. If it remains below 1% for a long time, the connection between EMBER and platform growth may still be weak.
Compared with one-time buybacks, ongoing pairing demand is closer to product-level token utility. But it also has reverse risk: when projects graduate, liquidity is withdrawn, or market heat declines, EMBER in pools may re-enter the market.
13. Does EmberCurve Have Real Usage Now? How to Avoid Vanity Metrics?
As of September 30, 2026, EmberCurve’s public market page already shows over a thousand markets and displays multiple Fee Modules and many Holder Rewards-type projects. This shows it is not just a whitepaper and roadmap. The platform already has actual issuance and trading activity.
But “having usage” and “having high-quality usage” are two different things.
Total Launches can easily be inflated by many low-cost token creations. Total Volume can also be amplified by a few hot projects, market-making activity, or short-term speculation. What is more worth recording over the long term is:
- Independent Active Launchers;
- Graduation Rate;
- 7-day and 30-day survival rates after graduation;
- Median volume per project;
- Median liquidity per project;
- Independent traders and volume for stock token pairs;
- EMBER Pair Share;
- Platform Gross Fees;
- Verifiable EMBER buyback amount.
A suggested definition of “high-quality graduation rate” is:
Number of projects still meeting minimum liquidity and daily volume thresholds 30 days after graduation ÷ total launches.
This better judges whether network effects are real than “how many coins the platform issued.”
14. How Will Council Governance Change Investment Risk?
EmberCurve’s current Council page shows holders can initiate or participate in governance around matters such as Fee Module, Holder Share, and Creator Side. Public pages also mention that participants holding a certain percentage of tokens can propose related changes.
Governance can reduce the risk of creators completely monopolizing the rules, but it also means today’s high reward mechanisms may not remain permanent.
Investors need to check:
- Who can initiate proposals;
- Whether voting power is based on balance;
- Whether large holders can easily control outcomes;
- Whether module changes have a time lock;
- Whether proposal execution is fully on-chain;
- Whether promised rewards can be paused or changed.
Governance is not automatically bullish. When tokens are highly concentrated, so-called community governance may just be whale governance.
15. Why Did EMBER Rise Fast and Then Pull Back Sharply?
EMBER’s initial launch combined multiple hot narratives at once: Solana Launchpad, Meteora, stock tokens, fee sharing, and buybacks and burns. This easily attracted short-term capital.
CoinGecko historical data records that EMBER reached an all-time high of about $0.04445, followed by a significant pullback. A market snapshot around September 29, 2026 showed a price of about $0.009, market cap of about $9 million, and circulating supply of about 989 million tokens. These numbers change continuously with the market and should be verified against live data at publication time.
A major drawdown does not automatically mean “cheap.” What really needs to be compared is the high point versus current fundamentals:
- Is 30-day platform volume rising or falling?
- Are Gross Fees growing?
- Are active creators increasing?
- Are high-quality graduated projects increasing?
- Is EMBER Pair Share improving?
- Is actual buyback amount increasing?
- Are token liquidity and holder count improving?
If price falls but platform trading, fees, and EMBER value capture continue to grow, valuation may become more attractive. If price, volume, fees, and users all decline together, the drawdown more likely reflects weakening market expectations.
16. Why Can’t EMBER Valuation Be Calculated Simply as Market Cap Divided by Platform Volume?
Trading Volume is not Revenue.
Dividing market cap directly by platform volume does not produce a useful conclusion like a stock’s P/S ratio, because trading volume must pass through multiple layers of allocation before it becomes EMBER value.
A more reasonable five-layer valuation model is:
Layer 1: Platform GMV
How much effective trading volume do all EmberCurve markets generate?
Layer 2: Gross Fees
How many taxes and trading fees do those trades actually generate?
Layer 3: Platform Economics
How are fees distributed among the platform, creators, holders, LPs, and different modules?
Layer 4: EMBER Value Capture
How much of that forms EMBER buybacks, burns, or quote pair demand?
Layer 5: Token Valuation
Is EMBER’s current market cap reasonable relative to annualized value capture?
You can further establish:
EMBER Capture Ratio = EMBER-related economic value ÷ EmberCurve total fees.
Suppose the entire ecosystem generates $1 million in fees, but only $10,000 is ultimately related to EMBER buybacks, burns, or effective pairing demand. The Capture Ratio is only 1%. In that case, even if the platform grows quickly, EMBER’s valuation may not be reasonable.
17. EMBER Price Prediction: Predict Market Cap First, Then Convert to Unit Price
For a token with a supply close to 1 billion, saying “EMBER can reach $1” easily ignores valuation.
Under a simplified assumption that supply of about 1 billion does not change dramatically:
- EMBER at $0.01 corresponds to a valuation in the $10 million range;
- EMBER at $0.10 corresponds to a valuation in the $100 million range;
- EMBER at $1 corresponds to a valuation in the $1 billion range.
Therefore, judging whether $1 is possible really asks: can EmberCurve generate enough volume, fees, active projects, and EMBER value capture to support a $1 billion token valuation?
Users can refer to EMBER price prediction to observe market trends, but model outputs should not be treated as guarantees. A better method for EMBER is Bull, Base, and Bear scenarios.
Bull Case: Platform Growth Clearly Transmits to EMBER
This requires simultaneously seeing active Solana issuance, rising EmberCurve market share, real volume in stock pairs, improving high-quality graduation rate, rising EMBER Pair Share, and buyback amounts that are meaningful relative to market cap.
Base Case: Product Continues Operating, but Value Capture Is Limited
The platform maintains some launches and volume, Fee Modules are differentiated, but heat is below the initial phase, and EMBER pairing share and buyback scale remain limited. In this case, EMBER is more like a high-risk Launchpad token with product support, and price continues to be affected by market cycles.
Bear Case: More Features, but Real Trading Keeps Declining
If demand for new token issuance falls, graduated projects lack follow-up volume, stock pairs see no usage, platform fees decline, and EMBER Pair Share remains very low for a long time, the token may lose valuation support.
Scenario analysis provides conditions, not fixed target prices. Any price prediction should be updated with platform data and market cycles.
18. EMBER Investment Strategy: Short-Term, Swing, and Long-Term Investors Should Watch Different Metrics
Short-Term Event Strategy
Short-term traders mainly watch CEX listings, major module updates, platform volume, EMBER’s own order book, SOL trends, and social sentiment.
Be especially wary of high turnover combined with low depth. High volume does not mean easy exit. If the order book is thin, large orders can still cause significant slippage.
Medium-Term Platform Growth Strategy
Medium-term investors should record Platform Volume, Gross Fees, active Launchers, high-quality graduation rate, EMBER Pair Share, and Buyback USD weekly or monthly.
If price rises while these metrics improve, the rally is more likely supported by fundamentals. If only price and social heat rise while platform data does not change in sync, the move is closer to narrative-driven.
Long-Term Value Capture Strategy
Long-term investment in EMBER is essentially a bet that EmberCurve can become a sustained issuance and fee module market on Solana, and that platform growth will increase EMBER demand.
The most important long-term question is not “how many more features will launch,” but:
For every $100 in fees EmberCurve earns, how much can be sustainably and verifiably converted into EMBER value?
Scaling-In Strategy
EMBER has historically been highly volatile, and price discovery is still incomplete. A more prudent approach than going all in at once is to establish a small observation position first, then reassess after platform data, value capture, and valuation improve together.
Scaling in does not eliminate risk. If the investment thesis has already failed, mechanically averaging down only increases exposure.
19. When Should You Admit the EMBER Investment Thesis Has Failed?
You can set clear failure signals:
- 30-day platform volume continues to decline;
- Gross Fees decline for multiple consecutive periods;
- Independent creators and active traders decrease;
- Graduation Rate and 30-day survival rate worsen;
- Stock token pairs consistently see no effective volume;
- EMBER Pair Share does not grow for a long time;
- Buybacks and burns clearly stall;
- Holder count and market liquidity continue to decline;
- Many projects trade only on launch day;
- Project mechanisms change frequently without clear disclosure.
When multiple signals appear at the same time, you cannot keep explaining price action only with “Solana and RWA are the future.” The reason to sell or reduce should be that the investment assumptions have changed, not simply that it fell by some amount on a given day.
20. The 16 Biggest Risks for EMBER
- Early project risk: primary adoption occurred in September 2026, and historical data is very short.
- Launchpad competition risk: token issuance platforms on Solana are highly competitive.
- Meme cycle risk: demand for new token creation and trading is clearly cyclical.
- Volume risk: most Fee Modules depend on continued trading.
- Low-quality launch risk: issuance count does not equal successful market count.
- Stock pair adoption risk: RWA pairs may remain at the concept level.
- Meteora dependency risk: core issuance and liquidity depend on third-party infrastructure.
- Mechanism complexity risk: the more modules there are, the harder it is for users to accurately understand returns and risks.
- Governance risk: current Fee Modules and Holder Share may be modified.
- Value capture risk: platform success does not equal EMBER success.
- Buyback sustainability risk: buyback scale depends on sustainable fees.
- Liquidity risk: EMBER depth is far smaller than large assets such as BTC and ETH.
- Whale risk: large wallets can significantly affect price.
- Smart contract risk: DBC, DAMM, and multiple modules create composability risk.
- Regulatory risk: tokenized stock pairs involve new RWA market structures.
- Information risk: dynamic ratios, market counts, and fee definitions may change quickly.
Locked liquidity can reduce some risk of creators directly pulling all LP, but it cannot prevent token price declines, whale selling, demand disappearing, or contract exploits. Any “Locked Liquidity” badge should not be understood as principal protection.
21. What’s the Difference Between EMBER, BNC4, and GSTOCK?
Users new to stock tokens and Stock-Meme can first learn What Is BNC4/USDT. BNC4’s core is closer to stock asset mapping and underlying stock logic. EMBER, by contrast, is a Launchpad ecosystem token that lets users create new markets around stock tokens, crypto, and memes.
The difference can be summarized as:
BNC4 is closer to “an RWA asset being traded,” while EMBER is closer to “a tooling platform asset that lets users issue tokens and create liquidity around different assets.”
What Is GSTOCK/USDT represents another Stock-Meme logic. GSTOCK investors mainly judge a single Stock-Meme’s volume, fees, and asset accumulation mechanism. EMBER investors judge whether “the platform business of issuing Stock-Memes and configuring fee modules” can continue to grow.
Simply put:
GSTOCK bets on whether one Stock-Meme succeeds; EMBER bets on whether a platform creating many cross-asset markets can keep attracting users.
Even if these assets can all be traded with USDT, the same valuation method cannot be applied to all of them.
22. Why Do BTC and ETH Prices Still Affect EMBER?
EMBER runs on Solana. Its direct fundamentals come from EmberCurve usage, not Bitcoin or Ethereum network revenue.
However, BTC price prediction and market cycles can still help gauge overall crypto risk appetite. When BTC enters a Risk-On phase, capital is more likely to flow into Solana, new tokens, and launchpads. When BTC falls sharply, liquidity in small-cap tokens usually shrinks faster.
ETH price prediction and Ethereum trends are better for observing on-chain RWA and tokenized equities competition. Ethereum and its Layer 2s, along with Solana, are competing for on-chain asset issuance and liquidity. But ETH rising does not directly increase EMBER’s protocol fees.
Therefore, BTC and ETH are external market variables. Platform Volume, Fees, and EMBER Capture Ratio are project-specific variables.
23. How to Buy EMBER: Complete Seven Checks Before Trading
Step 1: Confirm the Asset and Contract
The network should be Solana, and the contract should be:
5dvXTZ5qwgafnHtwu3Ls3QrWx1U4LQsFeCuJgkk4QEC6
There may be tokens with the same name on Solana. You cannot judge authenticity by ticker alone.
Step 2: Prepare USDT
Log in to HIBT and confirm the account has USDT available for spot trading. Also check whether the relevant services are permitted in your region.
Step 3: Search EMBER/USDT
Go to the spot trading page and verify the trading pair again. Do not accidentally choose a similarly named EMBER asset.
Step 4: Check the Order Book and Volume
Check bid-ask spread, order book depth, and 24-hour volume. A displayed price does not mean a large order can be fully filled at that price.
Step 5: Compare With On-Chain Markets
Observe whether there is a significant deviation between HIBT price and major DEX markets, especially during sharp volatility or when CEX liquidity is low.
Step 6: Choose Order Type
Market orders execute faster but may cause larger slippage when depth is insufficient. Limit orders can control price but do not guarantee execution.
Step 7: Set a Risk Budget in Advance
A new token should not be considered cheap just because its price is below one dollar. Position size should be determined by maximum acceptable loss, liquidity, and conditions that would invalidate the investment thesis.
24. 18 Metrics to Check Before Investing in EMBER
It is recommended to record the following weekly or monthly:
- EMBER price and market cap;
- Circulating supply and total supply;
- EMBER’s own liquidity;
- Number of holder addresses;
- Adjusted top-10 address concentration;
- EmberCurve 24-hour volume;
- EmberCurve 30-day volume;
- Platform Gross Fees;
- Total Launches;
- Active Launchers;
- Graduation Rate;
- 7-day post-graduation survival rate;
- 30-day post-graduation survival rate;
- Stock Pair Volume;
- EMBER Pair Share;
- EMBER buyback USD amount;
- Actual EMBER burned;
- Market Cap to annualized value capture ratio.
The most important to prioritize are:
30-day volume, Gross Fees, 30-day survival rate, EMBER Pair Share, Buyback USD, and current valuation.
These six answer whether the platform has usage, whether usage generates economic activity, launch quality, whether platform growth increases EMBER demand, whether buybacks are material, and whether the market has already priced in the future.
25. Is EMBER Worth Investing In? Three Conclusions Instead of a Simple “Buy or Don’t Buy”
Platform Growth Conclusion
EmberCurve has already formed a real product and gained differentiation through stock token pairing and Fee Modules. But its history is very short, and thousands of markets alone cannot prove long-term network effects.
Token Value Capture Conclusion
EMBER has potential value paths such as buybacks and burns and quote asset demand, but not all platform fees automatically belong to EMBER holders. Investors must continuously calculate the Capture Ratio rather than treating total volume as token revenue.
Market Valuation Conclusion
EMBER’s price and market cap experienced rapid expansion and drawdown in a short period. Whether valuation is reasonable should be determined jointly by platform fees, buyback amount, effective projects, pairing adoption, and market liquidity. You cannot conclude it is “cheap” just because the unit price is below $0.1.
Therefore, EMBER is more suitable for investors willing to continuously track on-chain data, tolerate high volatility, and understand Launchpad cycles. Those who chase it only because of RWA, Meteora, or Solana labels have not built a complete investment thesis.
26. FAQ: Common Questions About EMBER
What is EMBER?
EMBER is the EmberCurve ecosystem token on Solana. EmberCurve allows users to issue tokens through Meteora DBC, choose multiple quote assets, and configure Fee Modules.
What is EMBER/USDT?
It is an EMBER spot trading pair with USDT as the quote asset. The trading price represents how much USDT the market is willing to pay for one EMBER.
Which chain is EMBER on?
EMBER runs on Solana. The correct contract is 5dvXTZ5qwgafnHtwu3Ls3QrWx1U4LQsFeCuJgkk4QEC6.
Is EMBER a meme coin or a platform token?
It had obvious meme and speculative characteristics early after launch, but it is now connected to the EmberCurve Launchpad, buybacks and burns, and ecosystem pairing mechanisms. A more accurate description is an early Launchpad ecosystem token.
Is EMBER a tokenized stock?
No. EMBER does not represent any listed company’s stock, ADR, or ETF shares.
Does pairing with NVDAx mean NVIDIA stock backing?
No. Pairing only means using NVDAx for pricing and liquidity. It does not automatically give the new token NVIDIA stock collateral or shareholder rights.
What is Meteora DBC?
DBC stands for Dynamic Bonding Curve. Tokens trade on a virtual price curve and can migrate to a Meteora DAMM liquidity pool after reaching a Quote Threshold.
What does graduation mean in EmberCurve?
Graduation is the process by which a token reaches a Bonding Curve threshold and migrates liquidity. It is not the same as listing on a centralized exchange, nor does it mean price is protected.
How are EmberCurve fees distributed?
Different tokens can choose different tax rates, Holder Share, and Fee Modules. A single unified ratio cannot describe the entire platform.
Can holding EMBER earn all platform fees?
No. Fees from different projects may go to their own holders, creators, liquidity, or other modules. Only part of the activity may form EMBER value capture.
Why does EMBER buy back and burn?
Some ecosystem fees or modules can be used to buy EMBER from the market and burn it, reducing supply. Investors should verify the funding source, on-chain transactions, and burn size.
What is EMBER’s supply?
CoinGecko data around September 29, 2026 showed a circulating supply of about 989 million tokens. Supply changes due to burns and other factors, so the latest on-chain data should be used.
Is EMBER suitable for long-term holding?
The long-term thesis depends on whether EmberCurve can maintain volume, improve high-quality graduation rate, and convert more platform value into EMBER demand. A Launchpad or RWA narrative alone is not enough to support long-term holding.
What should I look at for EMBER price predictions?
Focus on Platform Volume, Gross Fees, 30-day survival rate, EMBER Pair Share, Buyback USD, supply, and market cap—not just extrapolating from historical candlesticks.
What is the biggest risk for EMBER?
The core risk is that the platform has many features and launches, but real trading declines, or platform growth cannot convert into EMBER value.
27. Conclusion: Investing in EMBER Is Ultimately a Bet on Whether Platform Growth Can Become Token Demand
EMBER is no longer just a Launchpad narrative token with no product. EmberCurve currently allows users to issue new tokens through Meteora Dynamic Bonding Curve, choose SOL, USDC, EMBER, memes, or even tokenized stocks as quote assets, and use multiple Fee Modules to direct fees toward Holder Rewards, Buyback & Burn, liquidity, and other uses.
This shows EmberCurve already has a real usable product, but it does not directly prove EMBER must appreciate.
The value chain that truly needs continuous verification is:
Effective launches increase → sustained trading volume increases → Gross Fees increase → high-quality markets increase → EMBER Pair Share rises → EMBER buybacks and demand rise → token value receives support.
If only the first three grow while EMBER pairing share, buyback amount, and real demand do not improve, the outcome may be platform success without the token fully capturing value.
Conversely, if more projects choose EMBER as a core quote asset, platform fees continuously form verifiable market buybacks, and graduated projects still have volume and liquidity after 30 days, EMBER is closer to upgrading from a “Launchpad Narrative Token” to an “ecosystem asset capable of capturing Launchpad growth.”
Therefore, the most important thing in analyzing EMBER is not predicting the next bounce, but continuously answering three questions: Does EmberCurve have real and sustainable users? Are platform fees growing? How much of that growth actually belongs to EMBER?
Sources and Data Notes
- HIBT EMBER Listing Announcement
- EmberCurve Official Website
- EmberCurve How It Works
- EmberCurve Stock Pairs
- EmberCurve Markets
- Meteora Official Documentation
- CoinGecko EmberCurve Market Data
Prices, market caps, supply, market counts, volume, and module configurations in this article are updated as of September 30, 2026. Dynamic data changes continuously, and different platforms may use different statistical definitions. Before trading, re-verify official pages, block explorers, and live market data.