
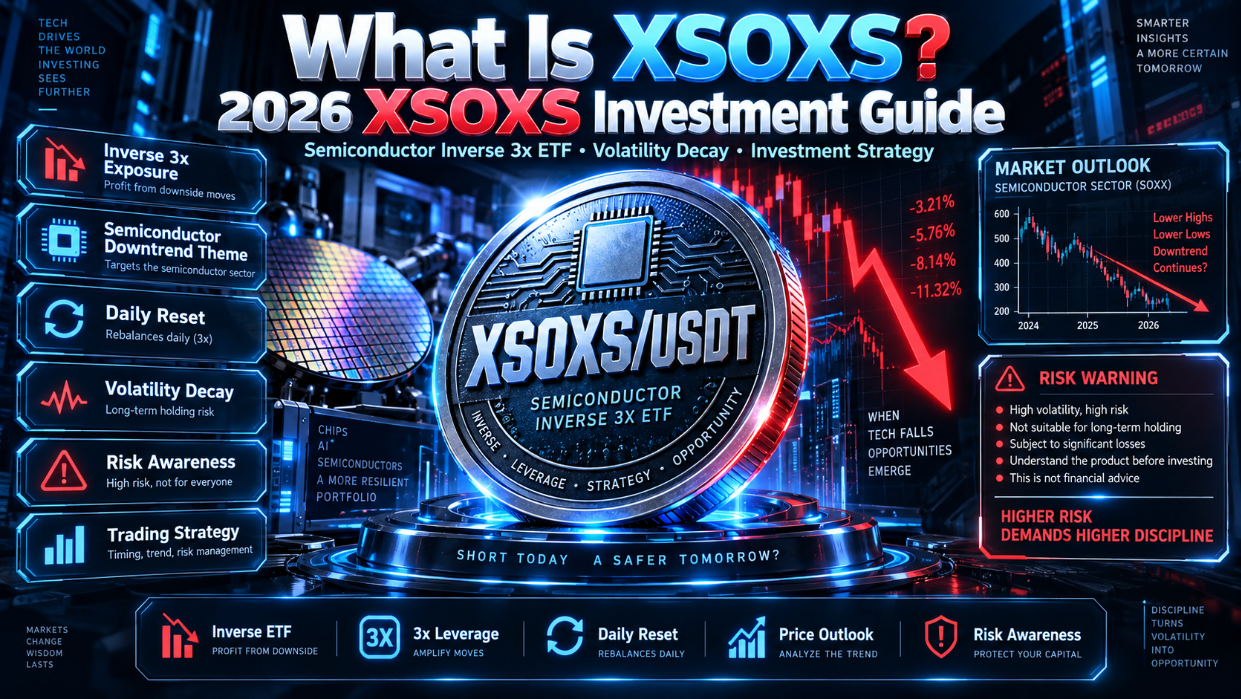
XSOXS is not an ordinary cryptocurrency valued on public-chain ecosystems, tokenomics, or community narrative. Its core trading logic is to gain price exposure related to Direxion Daily Semiconductor Bear 3X Shares (SOXS) through an on-chain or crypto trading environment. SOXS seeks to deliver -300% of the daily performance of the NYSE Semiconductor Index before fees, which is what people usually call a “daily semiconductor inverse 3x ETF.”
The most important word here is not “3x” but “daily.” SOXS targets one trading day, not simply -3 times the semiconductor index’s cumulative move over a week, a month, or a year. Daily resetting, compounding, volatility, and price path continuously change multi-day results. XSOXS is therefore closer to a short-term tactical tool that requires active management, not an ordinary investment product you buy and hold while waiting for semiconductors to fall.
Investors must also distinguish a four-layer structure: the NYSE Semiconductor Index is the reference index; SOXS is a US-listed inverse leveraged ETF; XSOXS may be a tokenized or platform-traded asset related to SOXS; and XSOXS/USDT is the specific secondary-market trading pair on a platform. If any layer has tracking error, insufficient liquidity, trading-hour mismatches, or issuance-structure issues, the final execution price may temporarily deviate from expectations.
You can use View XSOXS real-time price and market data to observe the order book, volume, and bid-ask spread. But before the issuer, underlying support method, network, contract address, and redemption mechanism are officially confirmed by the platform, you should not rely on the ticker alone to conclude that it is exactly the same as a public SOXSx product.
Risk notice: This article is for product mechanics, market structure, and risk education. It is not investment advice, a return promise, or a trading recommendation. Inverse leveraged ETFs can suffer major or total loss in a single day; tokenized trading formats add issuance, custody, contract, liquidity, platform, and regulatory risks.
Key Takeaways: 7 Points to Understand Before Trading XSOXS
- XSOXS’s core underlying logic comes from SOXS, and SOXS seeks -300% of the daily return of the NYSE Semiconductor Index.
- “Daily inverse 3x” does not mean “-3x of a cumulative decline over a period.” The longer you hold, the more important path dependency usually becomes.
- In a choppy market, both the semiconductor index and SOXS can lose money; SOXS is favored more by a sustained, broad decline with few rebounds.
- SOXS is not just a short on NVIDIA. It provides inverse exposure to an index that includes memory, GPU, CPU, networking chip, foundry, and semiconductor equipment companies.
- In 2026, SOXS implemented a 1-for-20 and then a 1-for-10 reverse split. A split does not create value out of thin air; it only adjusts the number of shares and the price per share.
- XSOXS may also carry premiums or discounts relative to SOXS, trading-hour mismatches, conversion-ratio risk, and on-chain infrastructure risk.
- It is better suited to tactical trades or hedges with a defined time horizon, risk budget, and exit conditions—not as an unmanaged long-term core position.
1. What Is XSOXS? First Distinguish the Index, ETF, Token, and Trading Pair
When people first see XSOXS/USDT, the most common mistake is to treat it as a crypto project named “XSOXS.” A more accurate research method is to confirm it layer by layer from the bottom up.
1.1 Layer One: The NYSE Semiconductor Index
Current Direxion materials show that SOXS references the NYSE Semiconductor Index (ICESEMIT). This is a rules-based, free-float market-cap adjusted, modified-weighted index covering 30 large US-listed semiconductor companies.
Older articles sometimes still describe SOXS as tracking the PHLX Semiconductor Index or simply call it the SOX Index. When researching the current product, use Direxion’s latest product page and fund documents as the authority, and avoid applying historical index information to the current product.
1.2 Layer Two: The SOXS Daily Inverse 3x ETF
SOXS stands for Direxion Daily Semiconductor Bear 3X Shares. The Direxion official product page shows that the fund seeks, before fees and expenses, to deliver -300% of the daily performance of the reference index.
If the index rises 1% that day, SOXS’s target is roughly to fall 3%; if the index falls 1% that day, the target is roughly to rise 3%. This is an idealized description. Actual results are also affected by management fees, financing costs, derivatives pricing, trading costs, rebalancing, and tracking error.
Direxion also explicitly warns that the fund should not be expected to provide -3x the benchmark’s cumulative return over periods longer than one day. This sentence is the most important product description for understanding SOXS.
1.3 Layer Three: XSOXS as a Tokenized Stock or Platform-Mapped Asset
Public RWA market materials show product names such as “3x Short Semiconductor ETF xStock (SOXSx),” indicating that there have already been attempts to bring SOXS-related economic exposure on-chain.
But “SOXSx exists in the market” does not automatically prove that XSOXS on the HIBT page is the same issuer, same legal structure, or same contract. Before trading, you should at least confirm:
- Full product name;
- Issuer and special purpose vehicle;
- Whether the underlying holds SOXS or replicates price synthetically through derivatives;
- Supported blockchain network;
- Official contract address;
- How many SOXS shares each XSOXS token represents;
- Minting, redemption, and market-making mechanisms;
- Eligible regions and investor qualifications;
- How dividends, splits, and other corporate actions are handled.
Until this information has been formally disclosed by the platform or issuer and cross-verified, the most rigorous statement is: XSOXS is an asset that provides SOXS-related price exposure in a crypto trading environment, not a confirmed equivalent of SOXS shares in a traditional securities account.
1.4 Layer Four: The XSOXS/USDT Trading Pair
XSOXS/USDT means XSOXS is quoted in USDT. The market price of this trading pair is affected not only by SOXS but also by the platform’s own order book depth, market makers, bid-ask spreads, user funds, and trading hours.
As a result, the underlying index, SOXS NAV, and XSOXS execution price can form three different sets of data. Traders cannot simply see “semiconductors fell” and assume their XSOXS position must rise by exactly 3x.
2. How Does SOXS Achieve “Daily Inverse 3x”?
SOXS typically builds inverse leveraged exposure through swaps, futures, or other derivatives and rebalances each trading day so that, at the start of the next trading day, its target exposure is reset close to -300% of the fund’s net assets.
2.1 What Does Daily Reset Mean?
Suppose SOXS starts a day with $100 in net assets and a target inverse exposure of about $300. If the index falls 5% that day, ideally the fund rises about 15%, and net assets become $115.
The next day’s target is not still based on the original $300. It resets around the new $115 of net assets, establishing about $345 of inverse exposure. This daily rebalancing is exactly why multi-day returns depend on the sequence of daily gains and losses.
2.2 A Simplified Formula for Multi-Day Returns
If the index’s daily returns are (r_1, r_2, \ldots, r_n), ignoring fees and tracking error, SOXS’s multi-day return can be approximated as:
[ R_{\text{SOXS}} \approx \prod_{t=1}^{n}(1 - 3r_t) - 1 ]
It is not equal to:
[ -3 \times \left[\prod_{t=1}^{n}(1 + r_t) - 1\right] ]
The difference comes from daily compounding and path dependency. The greater the volatility and the longer the holding period, the less this difference can usually be ignored.
3. Why Can SOXS Still Lose Money Even If the Semiconductor Index Returns to Its Starting Point?
This is the most important mathematical example to understand with inverse leveraged ETFs.
Suppose the semiconductor index falls from 100 to 90, a 10% decline on day one; on day two, it needs to rise 11.11% to go from 90 back to 100. After two days, the index’s cumulative return is 0%.
If SOXS perfectly delivers -3x daily:
- On day one, the index falls 10%, so SOXS rises 30%, from 100 to 130;
- On day two, the index rises 11.11%, so SOXS falls 33.33%, from 130 to about 86.67.
The index is back at 100, but SOXS has lost about 13.33% cumulatively. This is not a fund calculation error. It is the result of changing percentage bases from daily compounding.
This phenomenon is often called volatility decay or volatility drag, but “decay” is not a fixed fee deducted every day. More precisely, it is the mathematical result of high-leverage daily compounding along a choppy, back-and-forth path.
Therefore, when trading XSOXS, you cannot simply ask whether semiconductors will be lower in a few months. You also need to judge what ups, downs, and rebounds may occur along the way.
4. Is Daily Compounding Always a Headwind? Trending Markets Can Magnify Returns
Volatility drag does not mean SOXS must lose money over any period longer than one day. In a continuous, one-directional decline, daily compounding can actually produce returns higher than a simple -3x of the index’s cumulative decline.
Suppose the semiconductor index falls 5% for two consecutive days:
- The index falls from 100 to 95, then to 90.25, a cumulative decline of 9.75%;
- Ideally, SOXS rises 15% each day, from 100 to 115, then to 132.25, a cumulative gain of 32.25%.
A simple inverse 3x of the index’s cumulative decline would be only 29.25%, while SOXS gains 32.25%.
So what determines SOXS performance is not the word “volatility” by itself, but the combination of direction, volatility, duration, and the size of rebounds:
- Sustained one-way decline with few rebounds: daily compounding may help;
- High-frequency choppiness with repeated up-and-down moves: volatility drag is usually obvious;
- Sustained one-way rally: inverse 3x exposure can quickly cause major losses.
5. Can SOXS Get Liquidated? No Traditional Margin Call Does Not Mean Lower Risk
When shorting stocks directly, using futures, or trading perpetual contracts, investors may face margin calls and forced liquidation. When buying SOXS or a related spot token, there is usually no personal account-level margin liquidation price, and the maximum direct loss is generally the principal invested.
But that does not mean the risk is mild. Direxion explicitly warns that SOXS may lose all of its value in a single day. If the reference index were to rise about 33.33% in a single day under extreme conditions, the theoretical -3x daily return would be close to -100%. The actual fund may take risk-management measures, but investors should not mistake “no margin call notice” for “cannot go to zero.”
XSOXS adds a second layer of problems: even if the ETF operates normally, the token side may be unable to exit as expected because of liquidity drying up, minting or redemption suspensions, platform failures, contract events, or other issues.
6. Which Companies Is SOXS Actually Shorting? It Is Not an “NVIDIA Inverse Coin”
According to Direxion’s index data disclosed as of June 30, 2026, the top ten constituents of the NYSE Semiconductor Index include Micron, AMD, NVIDIA, Intel, Broadcom, Applied Materials, KLA, Marvell, Lam Research, and TSMC.
About 76% of industry weight is semiconductors, and about 24% is semiconductor materials and equipment. This structure shows that SOXS’s inverse exposure is not to a single AI GPU company, but to the entire semiconductor supply chain, including:
- GPUs and AI accelerators;
- DRAM, NAND, and HBM memory;
- CPUs and general-purpose computing;
- Networking and connectivity chips;
- Foundries;
- Etching, deposition, metrology, and other semiconductor equipment;
- Analog, automotive, and industrial chips.
Even if NVIDIA falls, the index can still hold up if memory, equipment, or other large constituents rise. Treating XSOXS simply as an “NVIDIA short tool” underestimates the offsetting effects within a diversified index.
Index constituents and weights also change. Any specific weights should be dated and checked against the latest fund materials.
7. What Fundamental Environment Actually Favors XSOXS?
The ideal environment for XSOXS is not a single piece of bad news about one company. It is a sustained, broad downtrend in the semiconductor industry that is confirmed by earnings expectations.
7.1 AI Capex Expectations Are Cut
Semiconductor valuations largely reflect future investment in AI infrastructure by cloud providers, model companies, and enterprise customers. If major customers such as Microsoft, Amazon, Meta, and Google lower data center capital expenditure guidance, demand expectations for GPUs, networking, memory, and optical interconnect could fall together.
But “slowing capex growth” is not automatically bearish. If the market had expected an even sharper decline, the actual data could still push stock prices higher. Trading SOXS requires comparing actual results with market expectations, not simply judging whether data is up or down year over year.
When tracking AI cloud infrastructure, you can combine What Is XCRWV and the AI Cloud Compute Thesis to judge whether compute rental demand, financing capacity, and data center expansion are changing.
7.2 Memory Cycle Reversal
Micron is currently one of the index’s important constituents. If DRAM, NAND, and HBM prices shift from undersupply to rising inventory, supply expansion, and falling average selling prices, memory companies’ earnings could see a sharp, high-beta decline.
This is why analyzing SOXS cannot focus only on GPUs. Investors can use What Is XMUU and Memory Chip Cycle Analysis to better understand the relationship among inventory, capital expenditures, HBM demand, and memory company profits.
7.3 Optical Communications and High-Speed Interconnect Demand Weakens
Large AI clusters need not only compute but also high-speed switching and optical interconnect. Order trends for 800G and 1.6T optical modules and related networking equipment can reflect whether data center expansion is still accelerating.
If optical module orders, lead times, and capacity utilization weaken at the same time, it may indicate that AI infrastructure demand is shifting from a boom to normalization. For this signal, see What Is AXTION and the AI Optical Communications Investment Thesis.
7.4 Semiconductor Inventory and Capex Deteriorate
A typical semiconductor downcycle often follows this chain:
Terminal demand slows, channel inventory rises, orders are cut, average selling prices fall, factory utilization drops, corporate profits are revised down, and capital expenditures are reduced.
If only stock prices fall short term while inventory, orders, gross margins, and earnings expectations are still improving, the SOXS move may be merely technical. If those indicators weaken together, the bear case is closer to a fundamental trend.
8. Why Is “the AI Bubble Will Burst” Not a Complete Enough Trading Thesis?
Even if a macro call is ultimately right, you can still lose money because of timing, path, and position-sizing mistakes.
Suppose an investor believes AI valuations will decline over the next year, but before the real decline begins, the semiconductor index first rises 25%, then chops sideways at highs for three months, and only then falls back to the starting point. Holding SOXS directly could suffer severe NAV decay during the early rally and mid-period chop. Even if the long-term direction eventually plays out, the position may not recover.
An effective XSOXS trading thesis must answer at least:
- Which part of the supply chain are you bearish on?
- When is the catalyst expected?
- How much pessimism is already priced in?
- Is the index forming a broad decline, or is it just one stock correcting?
- How long is the expected decline likely to last?
- How much rebound can you tolerate?
- What signal will make you admit the thesis is wrong?
“Valuations are expensive” can be a starting point for research, but it cannot replace entry timing, risk budget, and exit rules.
9. What Do the Two Reverse Splits in 2026 Tell Us?
Direxion implemented two reverse splits for SOXS in 2026: according to the March split announcement, SOXS executed a 1-for-20 reverse split; later, the July split announcement showed SOXS executed another 1-for-10 reverse split.
9.1 A Reverse Split Does Not Create Value
Suppose an investor originally holds 100 shares at $1 each, for a total value of $100. After a 1-for-10 reverse split, theoretically this becomes 10 shares at $10 each, still a total value of $100, ignoring fractional share handling and market fluctuations.
Therefore, a higher unit price after a reverse split is not a sudden fund rally, nor does it repair losses.
9.2 Why Do Inverse ETFs Often Need Reverse Splits?
When the semiconductor industry rises over the long term, SOXS’s NAV per share tends to keep falling because it provides daily inverse exposure. The fund manager uses reverse splits to raise the per-share price back into a more tradable range and may reduce per-share spread and commission effects. The Direxion ETF split FAQ also emphasizes that a split itself does not change the total value of an investment, but fractional share handling can create differences.
A reverse split is a price-maintenance mechanism. It is not the cause of long-term losses, but it may be one result of a long-term decline in NAV per share.
9.3 Why Historical Candlestick Charts Can Be Misleading
When looking at long-term SOXS charts, you must confirm whether prices are split-adjusted. Data that is not properly adjusted may show a sudden vertical jump that looks like a massive rally, but it is only a change in share units—not an abnormal return for holders.
For XSOXS, you also need to verify how the platform handles ETF splits: whether token quantity is reduced in sync, whether the conversion ratio is adjusted, when the platform suspends trading, and how reference prices are calculated while adjustments are incomplete. If the token layer does not sync in time, significant pricing deviations can occur.
10. Why Can Long-Term Deviation Be Much Larger Than 1% When the Expense Ratio Is Only 1%?
Direxion currently discloses that SOXS’s gross and net expense ratios are both 1.00%. This is an explicit, ongoing cost, but it is not the only source of multi-day performance deviation.
Long-term results are also affected by:
- Daily rebalancing;
- Volatility and path dependency;
- Derivatives financing costs;
- Swap and futures pricing;
- Trading costs;
- Fund tracking error;
- Cash holdings;
- Counterparty risk management;
- Trading spreads and premiums/discounts on the XSOXS side.
During high-volatility, choppy periods, path effects can create deviations far larger than the explicit 1% annual management fee. Therefore, comparing expense ratios alone cannot tell you whether XSOXS is suitable to hold.
11. Why Can XSOXS’s Price Diverge From SOXS’s NAV?
Even if XSOXS is genuinely backed by SOXS or equivalent assets, its secondary-market price is not guaranteed to match at every moment.
11.1 Different Trading Hours
SOXS primarily discovers price during US securities trading hours. Crypto platforms may offer longer trading windows. When US markets are closed but major semiconductor news breaks, XSOXS may reflect market expectations first and then recalibrate after the US open.
11.2 Different Liquidity and Market-Making Depth
SOXS volume in traditional markets does not directly represent the order book depth of XSOXS/USDT on a given platform. Even relatively small buy or sell orders can cause noticeable slippage.
11.3 Minting and Redemption Thresholds
Token prices tend to track the reference asset more closely only when qualified participants can efficiently create, redeem, or arbitrage. If cross-chain issues, compliance reviews, market closures, or infrastructure problems block arbitrage, premiums and discounts can widen.
11.4 Conversion Ratio May Not Be 1:1
After an ETF reverse split, the number of SOXS shares represented by one token may change. Before trading, use the latest conversion ratio and NAV per token disclosed by the issuer, rather than assuming XSOXS’s price must equal one SOXS share.
12. Why Can BTC and ETH Still Affect XSOXS Trading?
XSOXS’s underlying direction is mainly determined by US semiconductor stocks. A BTC rally does not raise SOXS’s NAV, and ETH network fees do not change the profits of NYSE Semiconductor Index constituents.
But XSOXS trades in a crypto environment, so BTC and ETH can still affect short-term price quality through USDT liquidity, platform risk appetite, on-chain funding costs, and secondary-market trading activity in the token.
Watching BTC Price Prediction and Market Cycle is better for judging whether crypto capital is in a risk-on or risk-off regime, not for predicting semiconductor fundamentals.
Watching ETH Price Prediction and Ethereum Ecosystem helps in understanding the on-chain liquidity environment for RWAs, stablecoins, and tokenized securities.
Always distinguish: the semiconductor index determines the main direction, while the crypto market determines some trading conditions. Neither can substitute for the other.
13. Is XSOXS Suitable for Hedging Long Semiconductor Exposure?
Yes, but the hedge ratio will drift and must be actively managed.
Suppose an investor has $10,000 of long semiconductor exposure and wants to hedge most market risk short term. Theoretically, about $3,333 of SOXS could provide close to $10,000 of inverse notional exposure on day one.
But after day one, both the long portfolio and SOXS will have different NAVs because of gains and losses, and the index constituents may not match the investor’s holdings. The hedge ratio therefore changes. If the investor holds a single stock like NVIDIA while SOXS corresponds to an index of 30 companies, there is also clear basis risk.
Using XSOXS as a hedge adds token-level deviation as well. A more reasonable approach is to define in advance:
- What is being hedged;
- Target hedge ratio;
- Expected holding period;
- Rebalancing frequency;
- Acceptable premium and spread;
- When to remove the hedge.
SOXS is more like dynamic insurance that needs to be checked daily, not a policy you buy once and that stays effective forever.
14. XSOXS Investment Strategies: Short-Term, Event Trading, and Hedging Require Different Rules
14.1 Short-Term Trend Strategy
Short-term traders do not focus on chip demand a year from now. They focus on whether the index is currently in a sustained downtrend. They may watch:
- Whether most index constituents are falling together;
- Whether the decline is accompanied by expanding volume;
- Whether rebounds keep running into resistance;
- Whether earnings expectations are being repeatedly revised down;
- Whether SOXS’s daily tracking of the index is normal;
- Whether XSOXS has an abnormal premium.
If the index falls briefly on a single news item and then quickly rebounds, SOXS’s path risk can be very high.
14.2 Earnings and Event Strategy
Earnings from NVIDIA, Micron, AMD, Broadcom, and large equipment companies can significantly affect the index. Before trading, you need to know when the event occurs, what the market expects, what option-implied volatility is, and whether other index constituents can offset the impact.
Betting on SOXS before earnings is not just about judging whether results are good or bad. You must judge how much the results differ from expectations. Even if revenue grows, the stock can fall if growth is below very high expectations—and vice versa.
14.3 Tactical Hedging Strategy
Investors who already hold long semiconductor exposure can use SOXS or XSOXS to reduce net exposure during specific risk windows, such as major earnings weeks, macro data releases, or the index breaking a key trend.
The goal of a hedge is usually to reduce portfolio volatility, not to maximize profit from SOXS itself. If the risk event ends, reassess whether the hedge is still necessary, so short-term insurance does not become a long-term drag.
14.4 Position Size Should Be Determined by Maximum Loss
For a -3x product, position size should not be based on “how much USDT I have” but worked backward from how much loss you can tolerate.
If the account has 10,000 USDT and the maximum loss allowed for a single trade is 1%, the risk budget is 100 USDT. If the trade plan’s exit point corresponds to a 10% drop in XSOXS, the theoretical maximum position size is about 1,000 USDT, before accounting for slippage, gaps, and token liquidity risk.
This is only a risk-management example, not a one-size-fits-all position recommendation. Actual position size should be further constrained by order book depth and extreme gap risk.
15. When Should You Exit or Admit the XSOXS Thesis Has Failed?
Defining invalidation conditions in advance is usually more important than predicting a precise target price.
Possible invalidation signals include:
- The semiconductor index re-forms a broad uptrend;
- Major constituents’ earnings expectations continue to be revised up;
- Hyperscalers increase AI capital expenditures;
- HBM, DRAM, and networking demand continue to beat expectations;
- The decline is concentrated in only a few stocks, and index breadth begins to improve;
- SOXS shows repeated abnormal tracking deviations;
- XSOXS trades at an unacceptable premium to reference NAV;
- XSOXS trading depth declines significantly;
- Issuance, redemption, or cross-chain functions are suspended;
- The original event window has ended.
Exiting does not necessarily mean your long-term semiconductor view has reversed 180 degrees. It may simply mean the current path is no longer suitable for a daily inverse 3x tool.
16. XSOXS Price Prediction: Use Path Scenarios Instead of a Single Target Price
XSOXS’s price depends simultaneously on semiconductor index direction, daily path, ETF tracking, and token pricing. Directly predicting “how high it will go by year-end” easily creates false precision.
You can use XSOXS Price Prediction as a trend reference, but a more practical approach is to build three scenarios.
16.1 Bull Case: A Favorable Scenario for XSOXS
This could include:
- AI capital expenditures are repeatedly cut;
- Semiconductor company earnings guidance declines;
- Memory prices and equipment orders weaken;
- Most index constituents fall together;
- The decline is sustained and rebounds are limited;
- SOXS tracking is stable;
- XSOXS liquidity is sufficient and there is no obvious premium.
Such a continuous one-way decline could make daily compounding favorable for SOXS.
16.2 Base Case: High-Volatility Choppiness
AI demand is still growing, but valuations are high. Good and bad news alternate, and the index frequently rises and falls. Even if the index ends slightly lower after a period, SOXS may fail to deliver a simple -3x return because of path dependency.
This is the environment most likely to produce “roughly right on direction, but still losing money on the trade.”
16.3 Bear Case: An Unfavorable Scenario for XSOXS
If demand for AI servers, HBM, networking chips, and semiconductor equipment continues to beat expectations, corporate earnings are revised up, and the index forms a sustained uptrend, SOXS could fall rapidly.
If XSOXS also has insufficient liquidity or trades at a discount, the exit result may be worse than SOXS’s NAV performance.
17. A 9-Factor Framework for Judging Whether XSOXS Is Worth Trading
Instead of asking “Can XSOXS still go up?”, check the following nine factors one by one.
1. Index Trend
Is the NYSE Semiconductor Index in an uptrend, downtrend, or range?
2. Market Breadth
Is the decline broad across most constituents, or is it only one or two heavyweight stocks correcting?
3. Earnings Revisions
Are analyst expectations for revenue, profit, and EPS being revised up or down?
4. AI Capital Expenditures
Are large cloud providers’ actual spending and forward guidance changing?
5. Memory and Equipment Cycle
Are inventory, average selling prices, orders, and utilization deteriorating together?
6. Volatility Path
Is the market in a sustained one-way decline, or is it swinging sharply back and forth?
7. SOXS Tracking Quality
Are daily results close to -300% of the index? Where is the deviation coming from?
8. XSOXS Pricing Quality
Is the token price showing a clear premium or discount to SOXS or reference NAV?
9. Product Structure
Have the issuer, custody, conversion ratio, contract, redemption, and regional restrictions been verified?
Only when the directional view, product structure, and trading conditions are all acceptable does XSOXS constitute a relatively complete trading plan.
18. 15 Risks You Must Know Before Trading XSOXS
1. Daily Leverage Risk
SOXS targets -3x daily performance. An extreme one-day rally could cause major or total loss.
2. Volatility Drag Risk
Back-and-forth index moves can cause SOXS to keep losing NAV.
3. Path Dependency Risk
The same ending index level can produce completely different SOXS results depending on the sequence of gains and losses.
4. Long-Term Holding Risk
The longer you hold, the less appropriate it is to estimate results by simply multiplying cumulative index return by -3.
5. Inverse Correlation Risk
The fund does not guarantee exactly -300% every day, especially in extreme markets.
6. Derivatives Risk
Swaps, futures, and other instruments carry pricing, liquidity, and execution risk.
7. Counterparty Risk
A derivatives counterparty may fail to perform.
8. Rebalancing Risk
Daily exposure adjustments may increase trading costs and market impact around the close.
9. Semiconductor Industry Concentration Risk
The product is highly concentrated in one volatile industry and lacks cross-sector diversification.
10. Reverse Split Misinterpretation Risk
A split raises the per-share price but does not increase total value. Unadjusted charts can mislead.
11. Token Mapping Risk
Whether and how XSOXS corresponds to SOXS must be based on formal legal and product documents.
12. Premium and Discount Risk
The token’s traded price may deviate from SOXS’s NAV or reference value.
13. Liquidity Risk
When the order book is thin, market orders can cause severe slippage.
14. Smart Contract, Cross-Chain, and Platform Risk
Contract vulnerabilities, bridge failures, deposit/withdrawal suspensions, or platform events can all affect asset availability.
15. Regulatory and Regional Restriction Risk
The issuance and trading of tokenized securities may be restricted by jurisdiction, accredited-investor rules, or sanctions rules, and the rules may change.
19. Check These 15 Items Before Placing an Order, Not the Top Gainers/Losers List
Before trading, you can work through the following checks:
- Full XSOXS product name;
- Issuer;
- Official network and contract address;
- Underlying asset or synthetic replication method;
- SOXS shares per token;
- Latest corporate actions and split adjustments;
- Reference NAV and SOXS market price;
- XSOXS premium or discount;
- 24-hour volume;
- Order book depth and estimated slippage;
- Minting, redemption, and deposit/withdrawal status;
- Current NYSE Semiconductor Index trend;
- Major earnings and macro event calendar;
- Maximum allowable loss and exit point;
- Whether your location permits participation.
For a structurally complex tokenized leveraged ETF, price should come later in the due-diligence process, not first.
20. How to Buy XSOXS: The XSOXS/USDT Example
If the platform has made the asset available in your location, the usual process is: log in, prepare USDT, search XSOXS/USDT, verify product information, check the order book, and then choose a limit or market order.
But compared with ordinary crypto, at least three extra steps are needed:
20.1 First Verify SOXS and the Reference Index
Confirm the current US-market SOXS price, NAV, daily change, and semiconductor index performance, rather than judging direction solely from the token’s candlestick chart.
20.2 Then Calculate Premium, Discount, and Conversion Ratio
If one XSOXS does not equal one SOXS share, you must first calculate the theoretical reference value using the latest conversion ratio. This is especially important to re-verify after an ETF split.
20.3 Prefer Limit Orders
For newly listed or thinly traded assets, a market order may fill across multiple price levels. A limit order does not eliminate risk, but it can cap the highest buy price or set a minimum sell price.
After the trade, daily review is still required because the underlying fund’s objective itself resets daily.
21. FAQ: The Most Common Questions About XSOXS
What is XSOXS?
XSOXS is an asset that provides SOXS-related price exposure in a crypto trading environment. Its core logic comes from a daily inverse 3x semiconductor ETF, not from an independent crypto project’s tokenomics.
What coin is XSOXS?
Calling it a “coin” is misleading. More accurately, it is a tokenized trading asset tied to a stock or ETF; the exact legal structure should be based on formal platform and issuer documents.
Which index does SOXS track?
Current Direxion materials show SOXS tracks -300% of the daily performance of the NYSE Semiconductor Index. Older references to PHLX/SOX should not be applied directly to the current product.
Is XSOXS equal to shorting NVIDIA?
No. The reference index includes 30 large semiconductor companies across GPUs, memory, CPUs, networking, foundries, and semiconductor equipment.
Why is SOXS not suitable for long-term holding?
Because daily resetting, compounding, and path dependency cause multi-day results to deviate from a simple -3x of the index’s cumulative return. Choppy markets can create especially significant NAV drag.
If the semiconductor index falls, will XSOXS definitely rise?
Not necessarily. First, it depends on which trading day and path the decline occurs in; second, SOXS has tracking error; finally, XSOXS is affected by conversion ratio, premium/discount, and liquidity.
Can SOXS get liquidated?
Buying ETF shares generally does not involve a personal margin-account liquidation line, but the fund can suffer major or total loss in a single day. No liquidation notice does not mean principal is safe.
Is a SOXS reverse split bullish?
No. A reverse split simply reduces the number of shares and proportionally raises the price per share, leaving theoretical total value unchanged. It does not repair an investor’s prior economic losses.
Can XSOXS be used to hedge chip stocks long term?
It can be used as a short-term tactical hedge, but exposure changes daily, and the reference index may not match your individual stock portfolio. Long-term use requires frequent calculation and rebalancing.
How should XSOXS price predictions be viewed?
First judge the daily path of the semiconductor index, then assess SOXS tracking and token premium/discount. Bull, Base, and Bear scenarios are more useful than a fixed target price.
What is the biggest risk of XSOXS?
The core risk is daily 3x leverage and path dependency; tokenization adds issuance structure, liquidity, platform, contract, and regulatory risks.
Is XSOXS suitable for beginners?
It is generally not suitable as a beginner’s first investment product. Investors need to understand the semiconductor industry, inverse leveraged ETFs, daily resetting, and tokenized pricing mechanisms at the same time.
22. Conclusion: Trading XSOXS Is Really a Bet on the “Path of Decline,” Not Just the Direction
On the surface, XSOXS offers an intuitive way to express a view: if you are bearish on semiconductors, buy an inverse 3x asset. But the actual result is far more complex than that sentence.
From the underlying asset to the trading end, it contains at least four layers:
Semiconductor industry fundamentals determine the broad direction of the NYSE Semiconductor Index; the index’s daily moves determine SOXS’s target return; daily resetting and the volatility path determine multi-day compounding; and the issuance and trading structure determine whether XSOXS can transmit SOXS’s price accurately and smoothly.
Therefore, judging whether XSOXS is worth participating in cannot be reduced to “Will AI chips fall?” You must also ask:
- Will the decline cover most semiconductor constituents?
- Is it a continuous decline, or high-volatility choppiness?
- When will the catalyst occur, and how much is already priced in?
- Is SOXS tracking stable?
- Are the issuer, network, contract, and conversion ratio of XSOXS clear?
- Is the order book deep enough to support entry and exit?
- What condition would invalidate the trading thesis?
XSOXS is best understood as a high-risk, strongly path-dependent tactical tool that requires daily management. It is not an automatic way to cash in on a long-term bearish semiconductor view, nor is it a product that mechanically multiplies the index’s cumulative decline by three.
For investors, the most important conclusion can be condensed into one sentence:
Trading XSOXS is not just a bet that semiconductors will fall; it is a bet that they will fall within your chosen time window along a path that is sustained enough, broad enough, and has few enough rebounds.
If the path, time horizon, or product mapping cannot be confirmed, the most reasonable choice is not to increase leverage to prove your view, but to reduce position size, shorten the holding period, or wait for clearer trading conditions.